Aquaculture Innovation: Transforming Sustainable Shrimp Farming
Shrimp farming has long struggled with inefficiencies due to outdated methodologies and the lack of real-time data. iQuatic was designed to address these challenges through a web and mobile application that streamlines data management and enhances decision-making for farm technicians and managers.

My Role
I led the user experience strategy and design execution for iQuatic. My responsibilities included:
- Conducting user research through farm visits, interviews, and surveys.
- Facilitating UX workshops to gather stakeholder insights.
- Developing information architecture and user flow diagrams.
- Designing wireframes, high-fidelity mockups, and interactive prototypes.
- Conducting usability testing and iterative design improvements.
- Establishing a scalable design system for consistency across platforms.
Key Findings
- High Manual Data Errors: Paper-based logging had a 35% error rate.
- Time-Consuming Reporting: Farm technicians spent 20+ hours/week converting paper data to digital reports.
- Lack of Real-Time Insights: Farmers needed predictive tools for better decision-making.
- Usability Issues: Existing systems had complex interfaces, leading to low adoption.
User Research and Design Process
Empathizing with Users
Understanding the real-world challenges of shrimp farming was crucial. Research was conducted through farm visits, user interviews, and surveys to ensure that the iQuatic solution was aligned with user needs.
- Farm Visits & Observations: Gained firsthand insights into farm operations and data collection challenges.
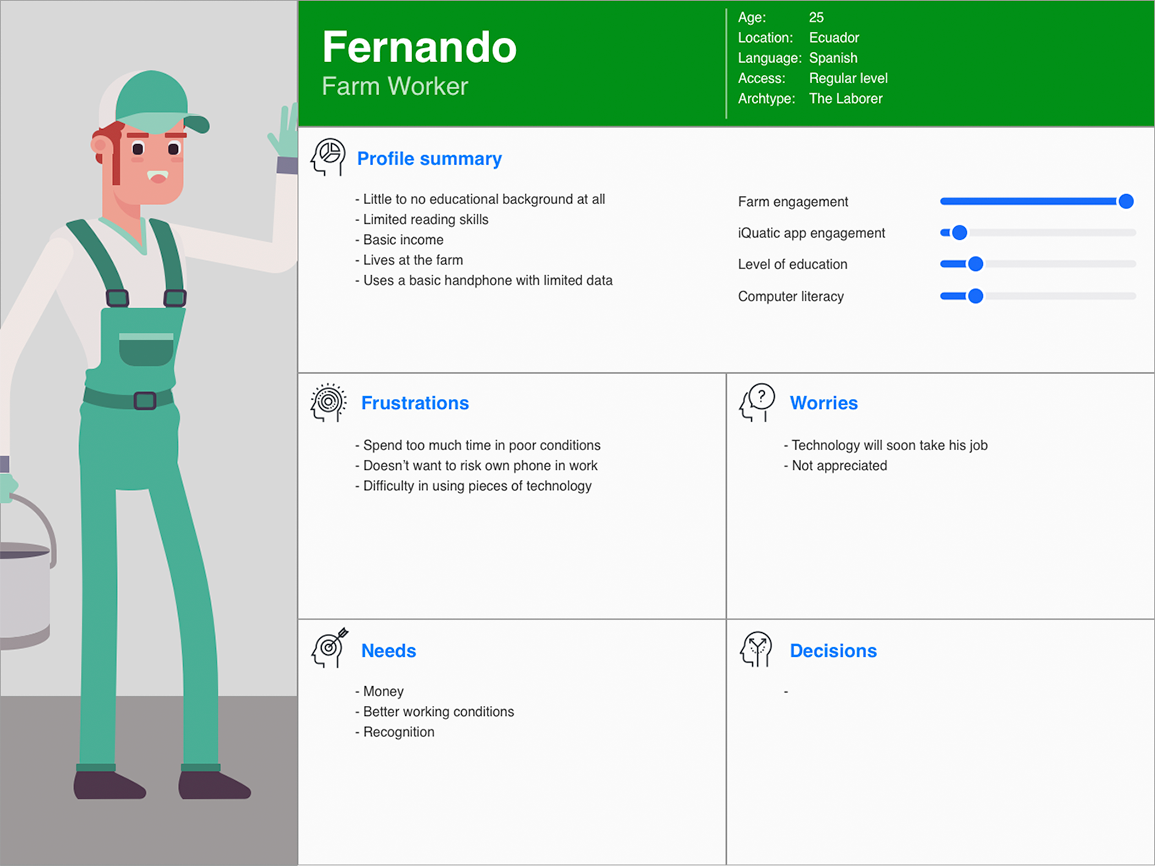
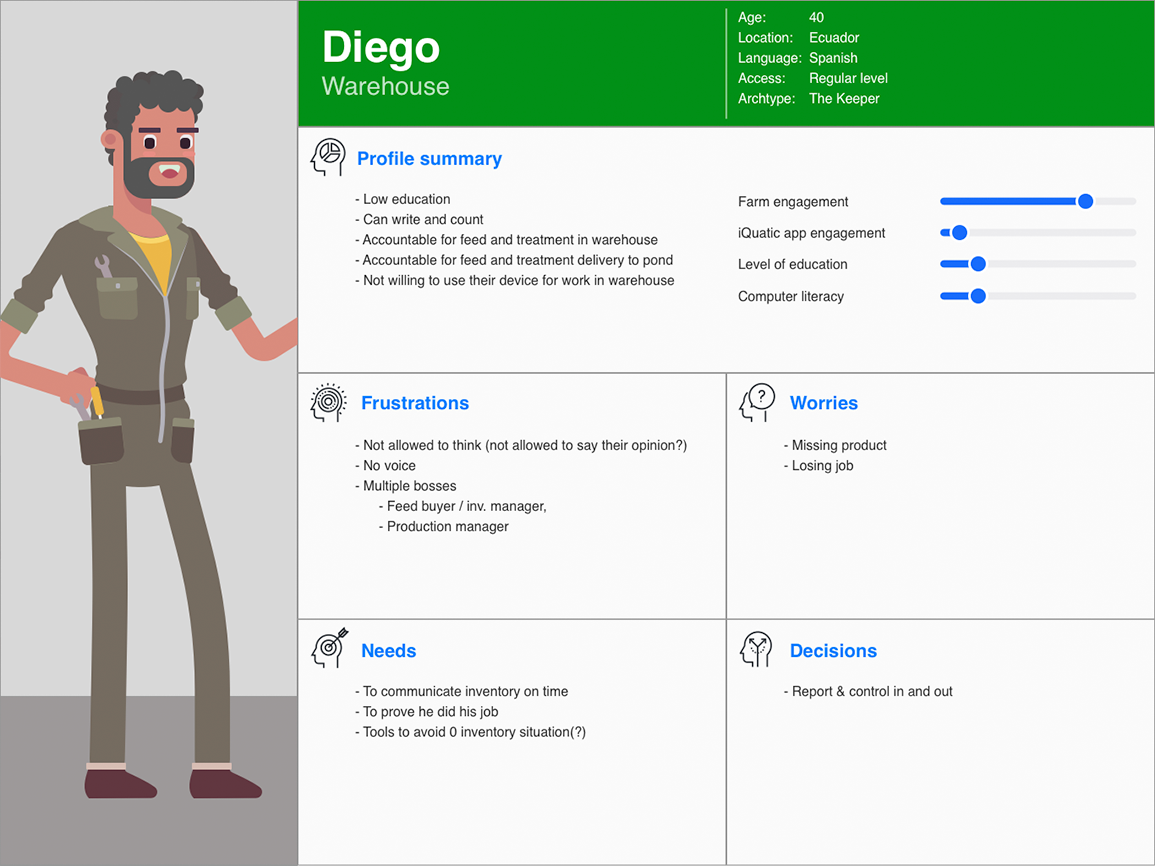
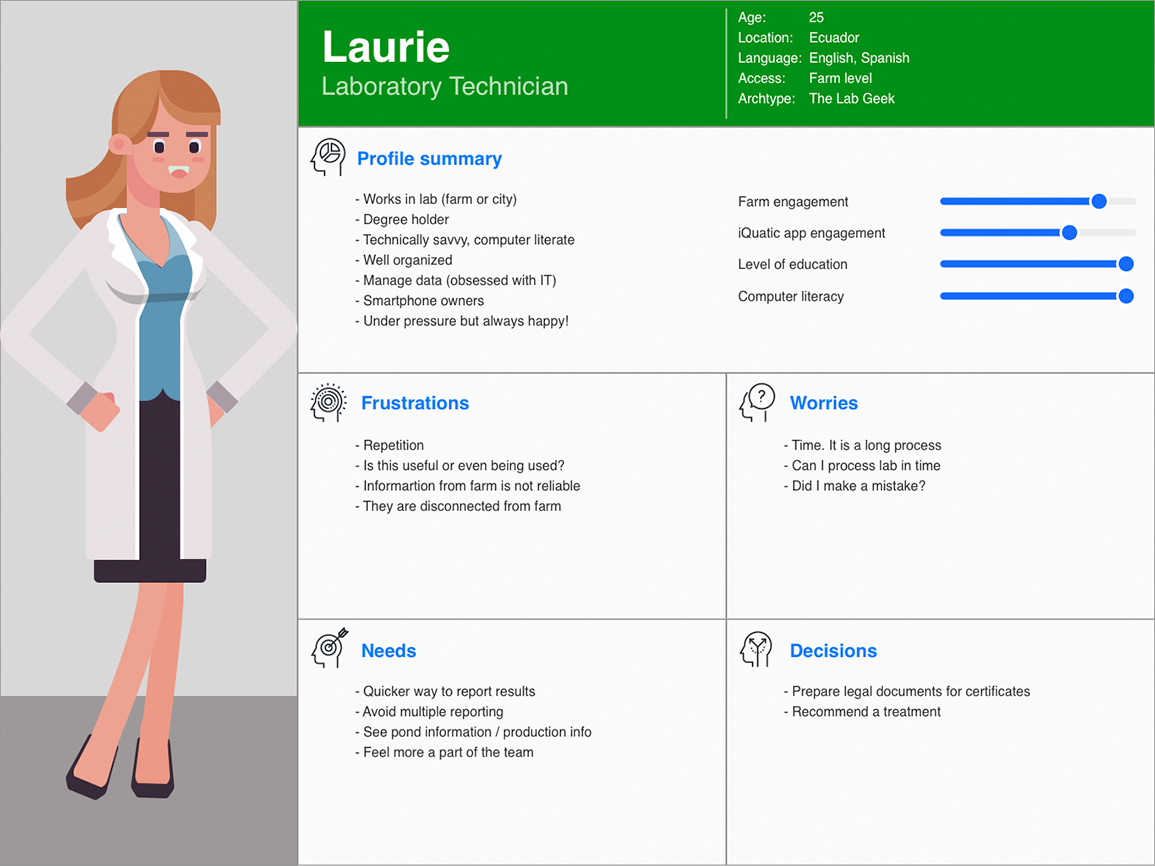
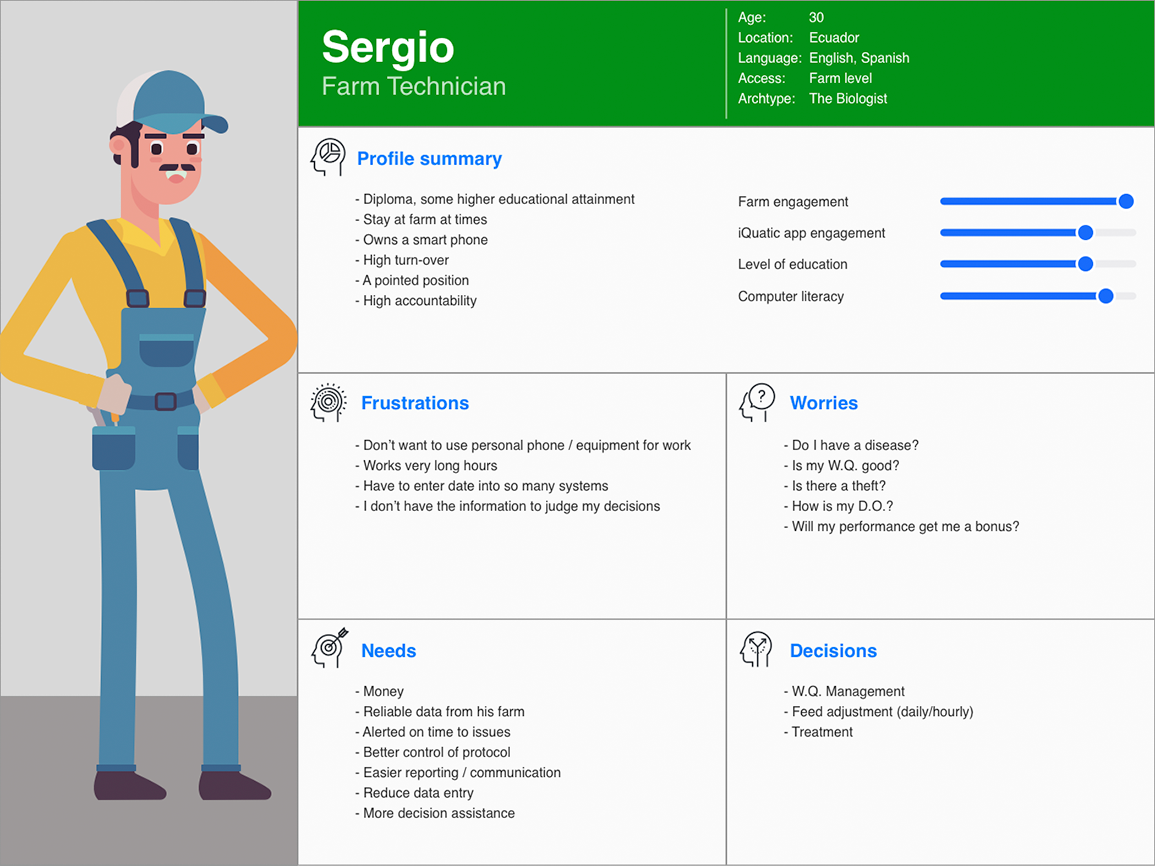
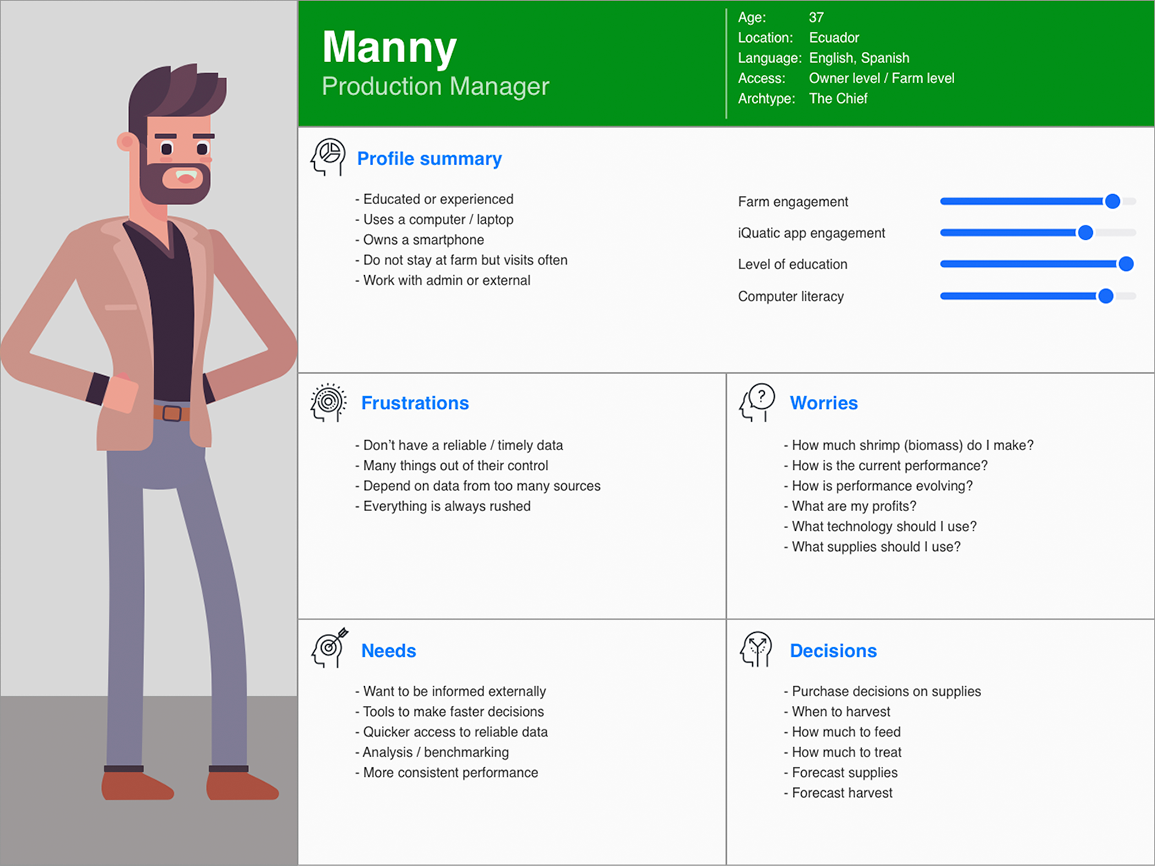
- User Personas: Developed detailed personas representing farm technicians and managers.
- Empathy Mapping: Identified user pain points and emotional drivers.
- User Journey Mapping: Mapped out interactions with the system to highlight inefficiencies.
- Mind Mapping: Explored key concepts related to shrimp farming and operational needs.
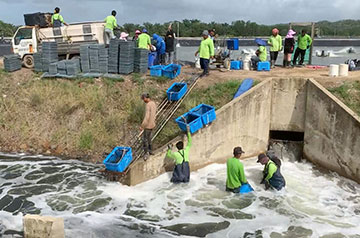
Shrimp farm workers harvesting the shrimps
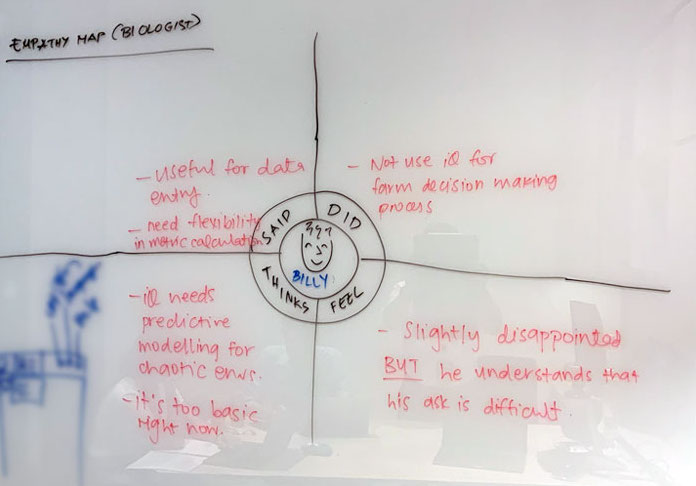
Empathy mapping is done carefully and thoroughly to better understand user needs and emotions.

User journey from initial interaction to goal completion, identifying pain points and areas for improvement.
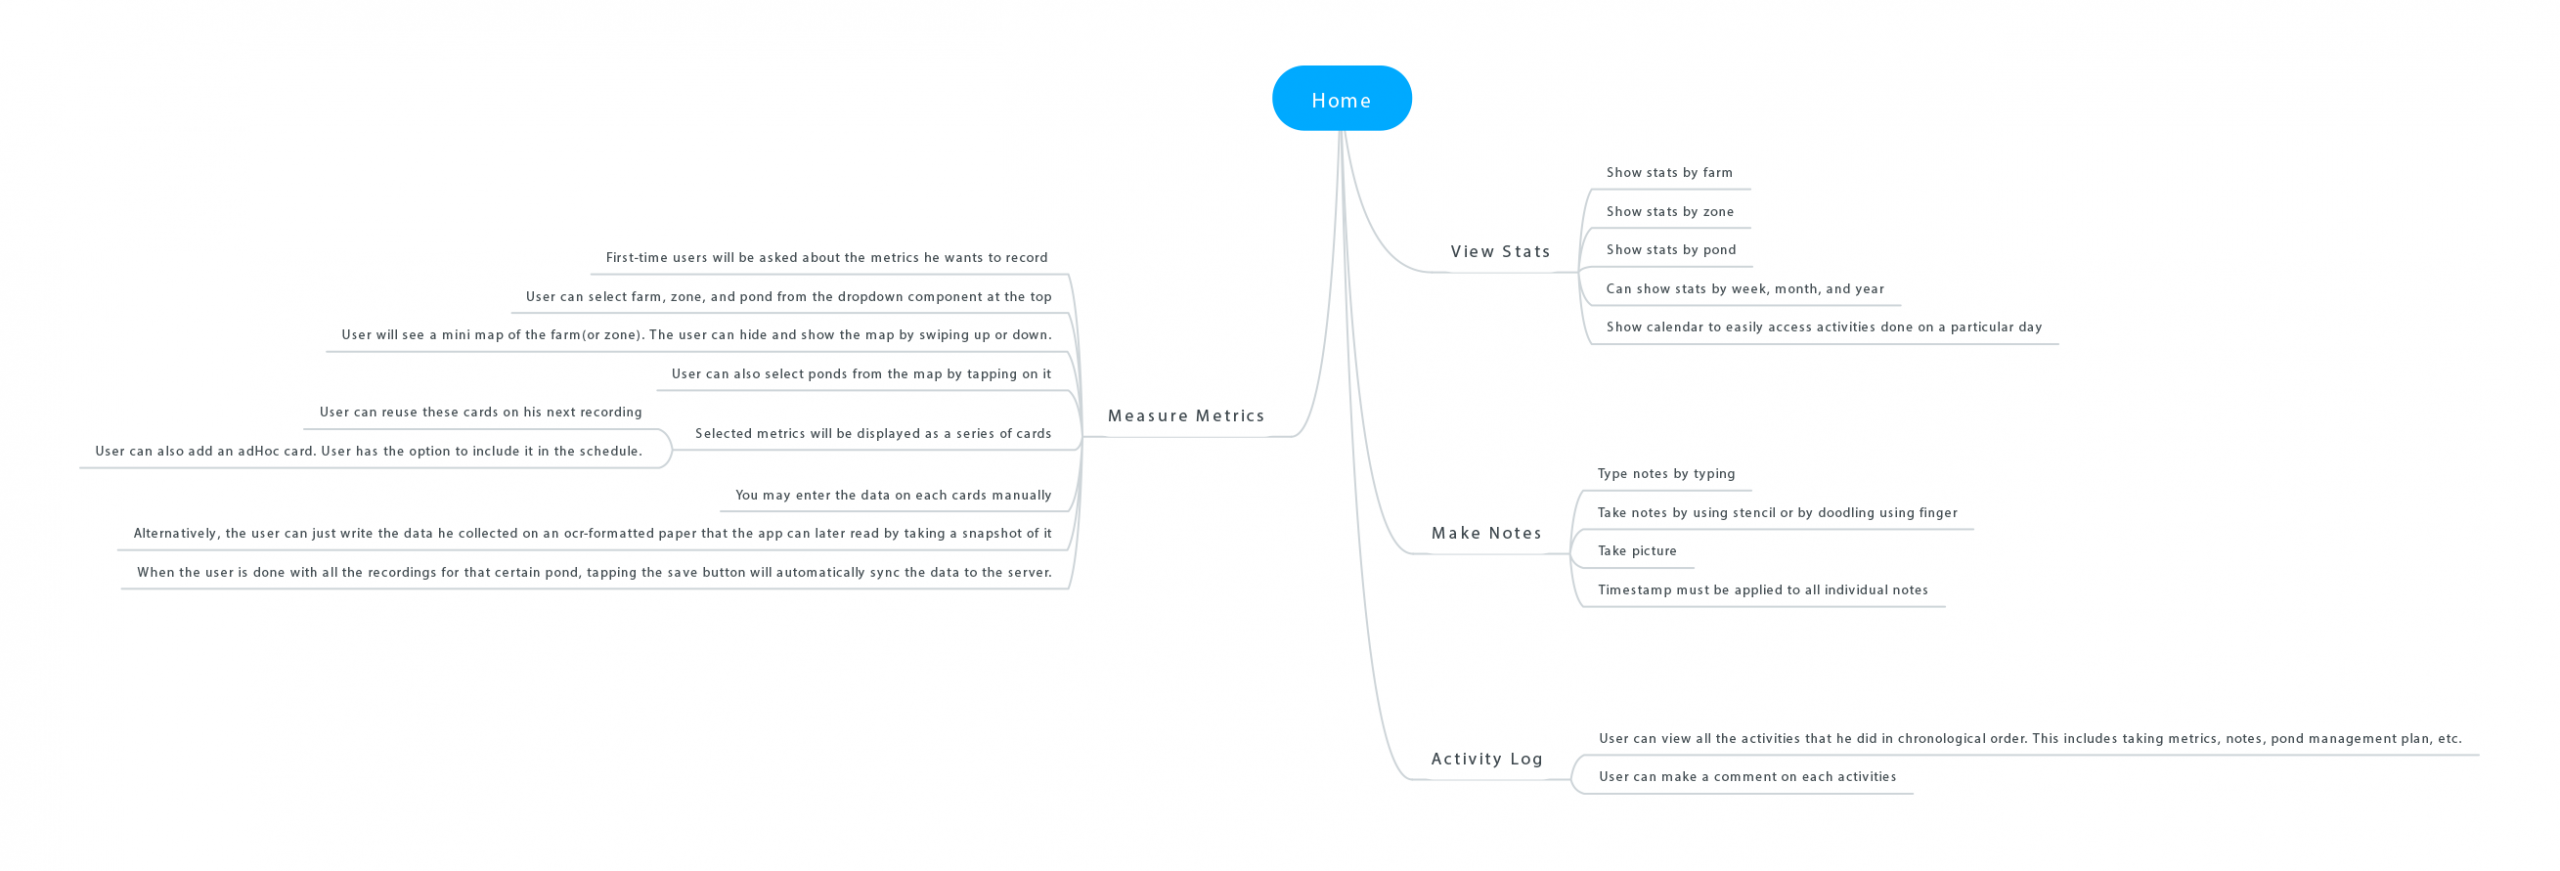
Refined mind map
Value Proposition
Based on research insights, iQuatic’s core features were designed to address critical pain points:
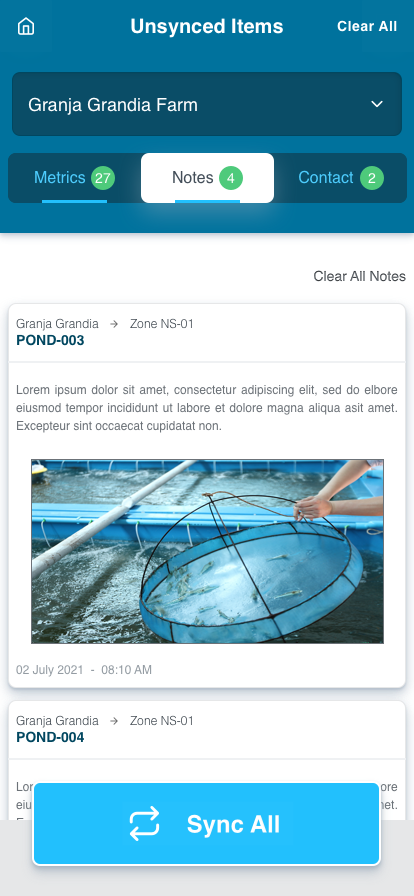
- Mobile App: Real-time data entry under various conditions.
- OCR Reader: Automates paper-to-digital data conversion.
- Instant Reports: Quick generation of critical insights.
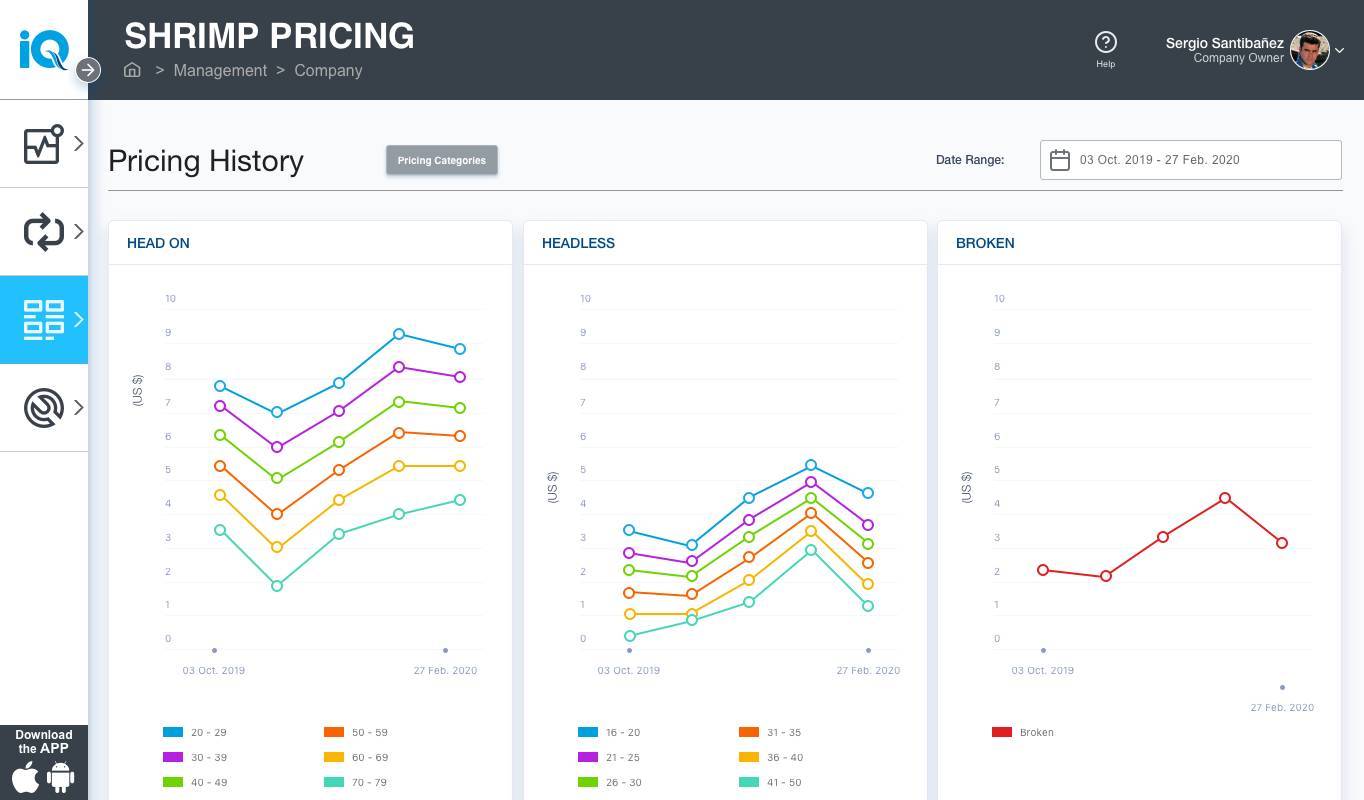
- Expense Tracking: Monitors farm costs and market trends.
- Predictive Analytics: AI-driven feeding and harvesting recommendations.
- Enhanced UI/UX: Simplified navigation for all user levels.
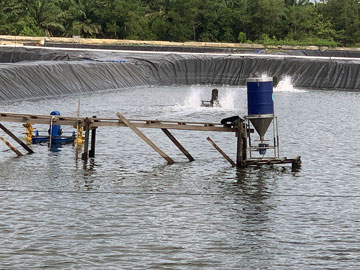
Shrimp pond auto-feeder machine
Design and Prototyping
Wireframes and User Flows
Before diving into high-fidelity design, we developed wireframes to map out the key interactions. User flows were created to ensure smooth navigation and logical task completion.
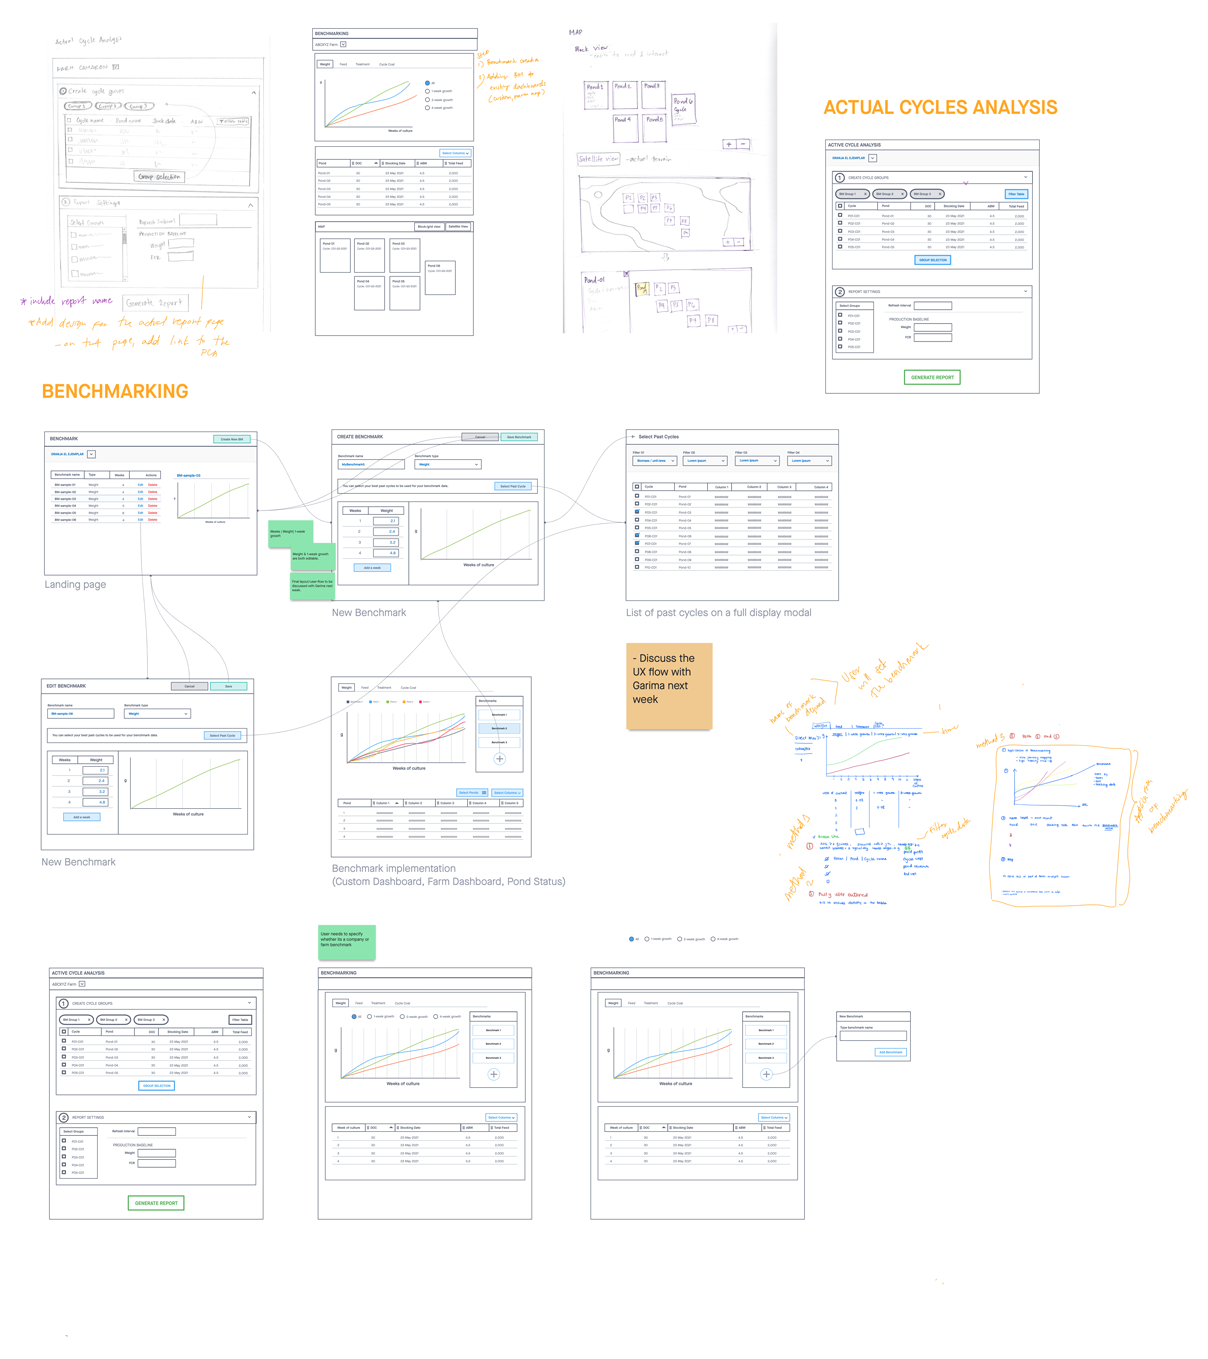
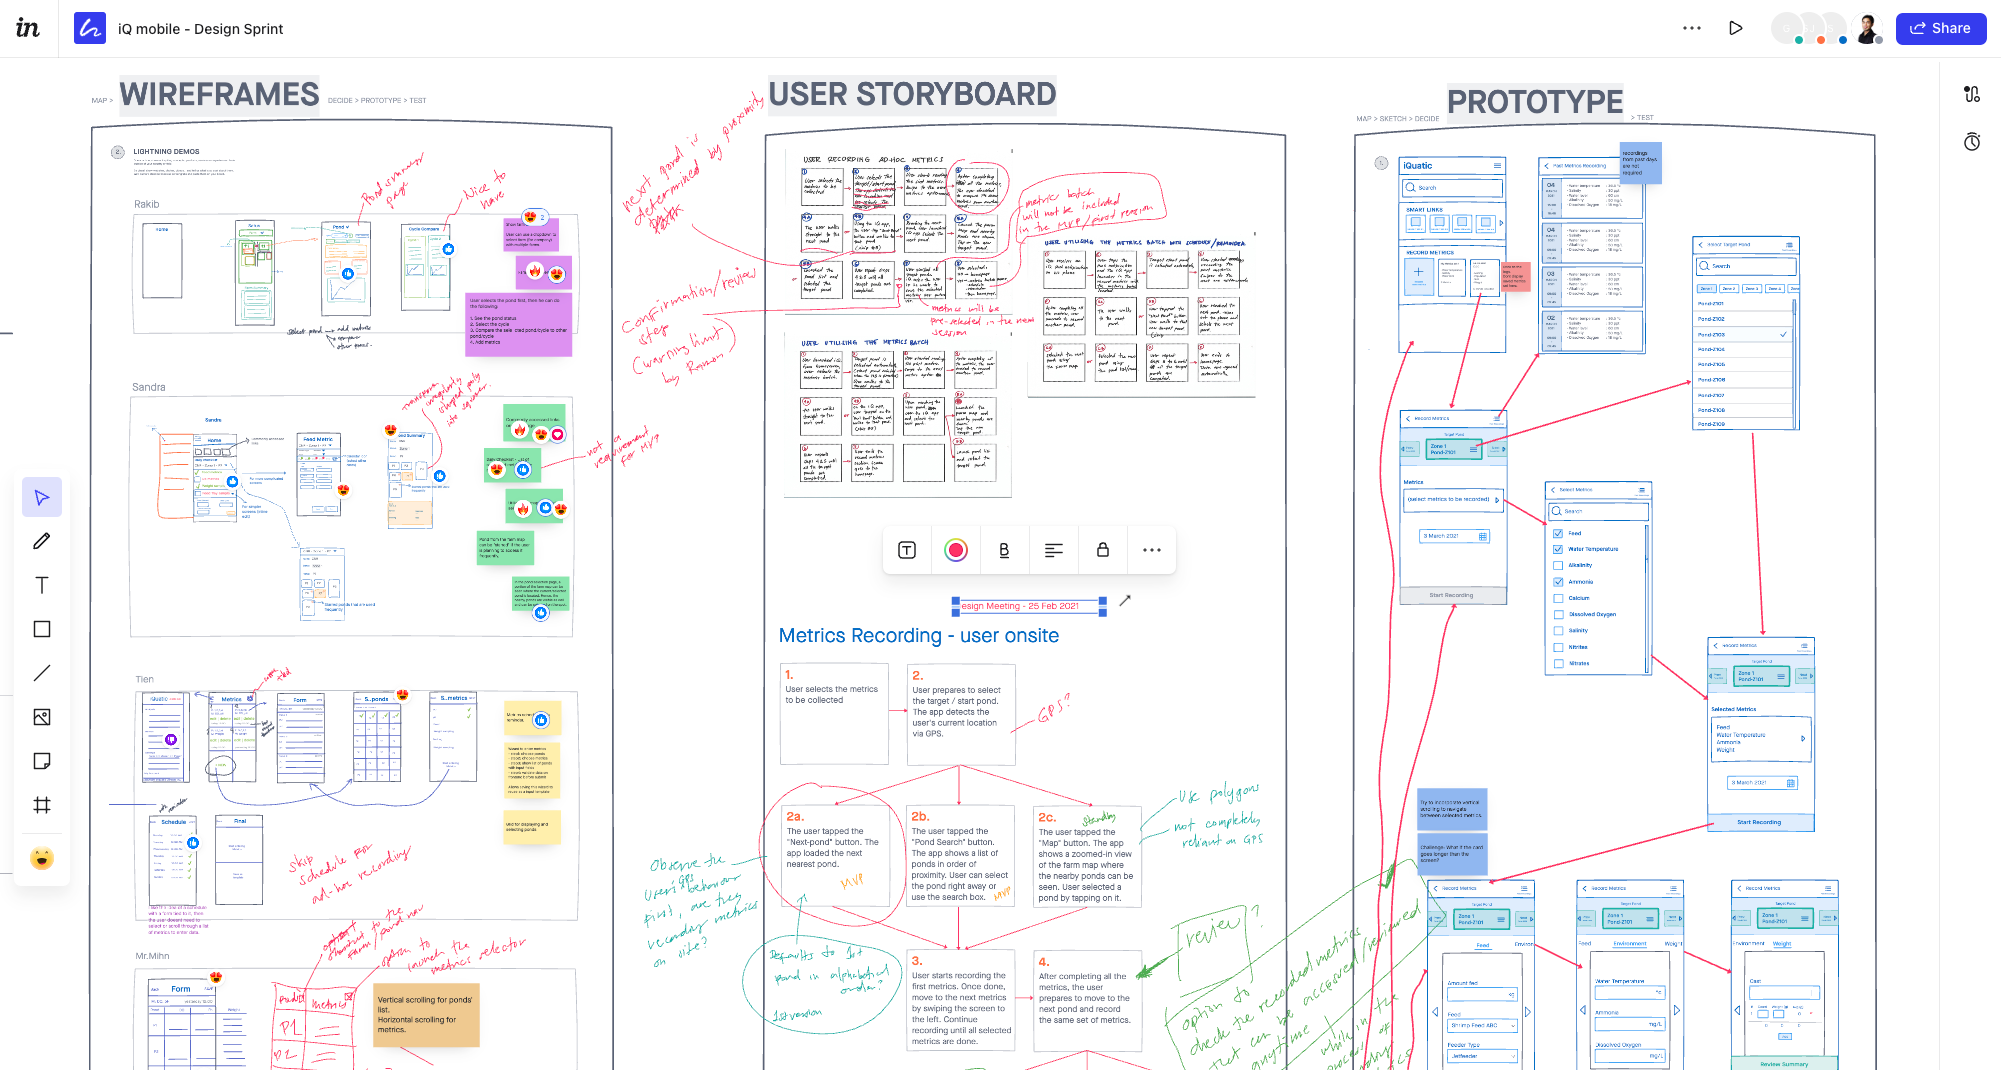
A combination of hand sketching and InVision is used to work on the wireframes for team collaboration.
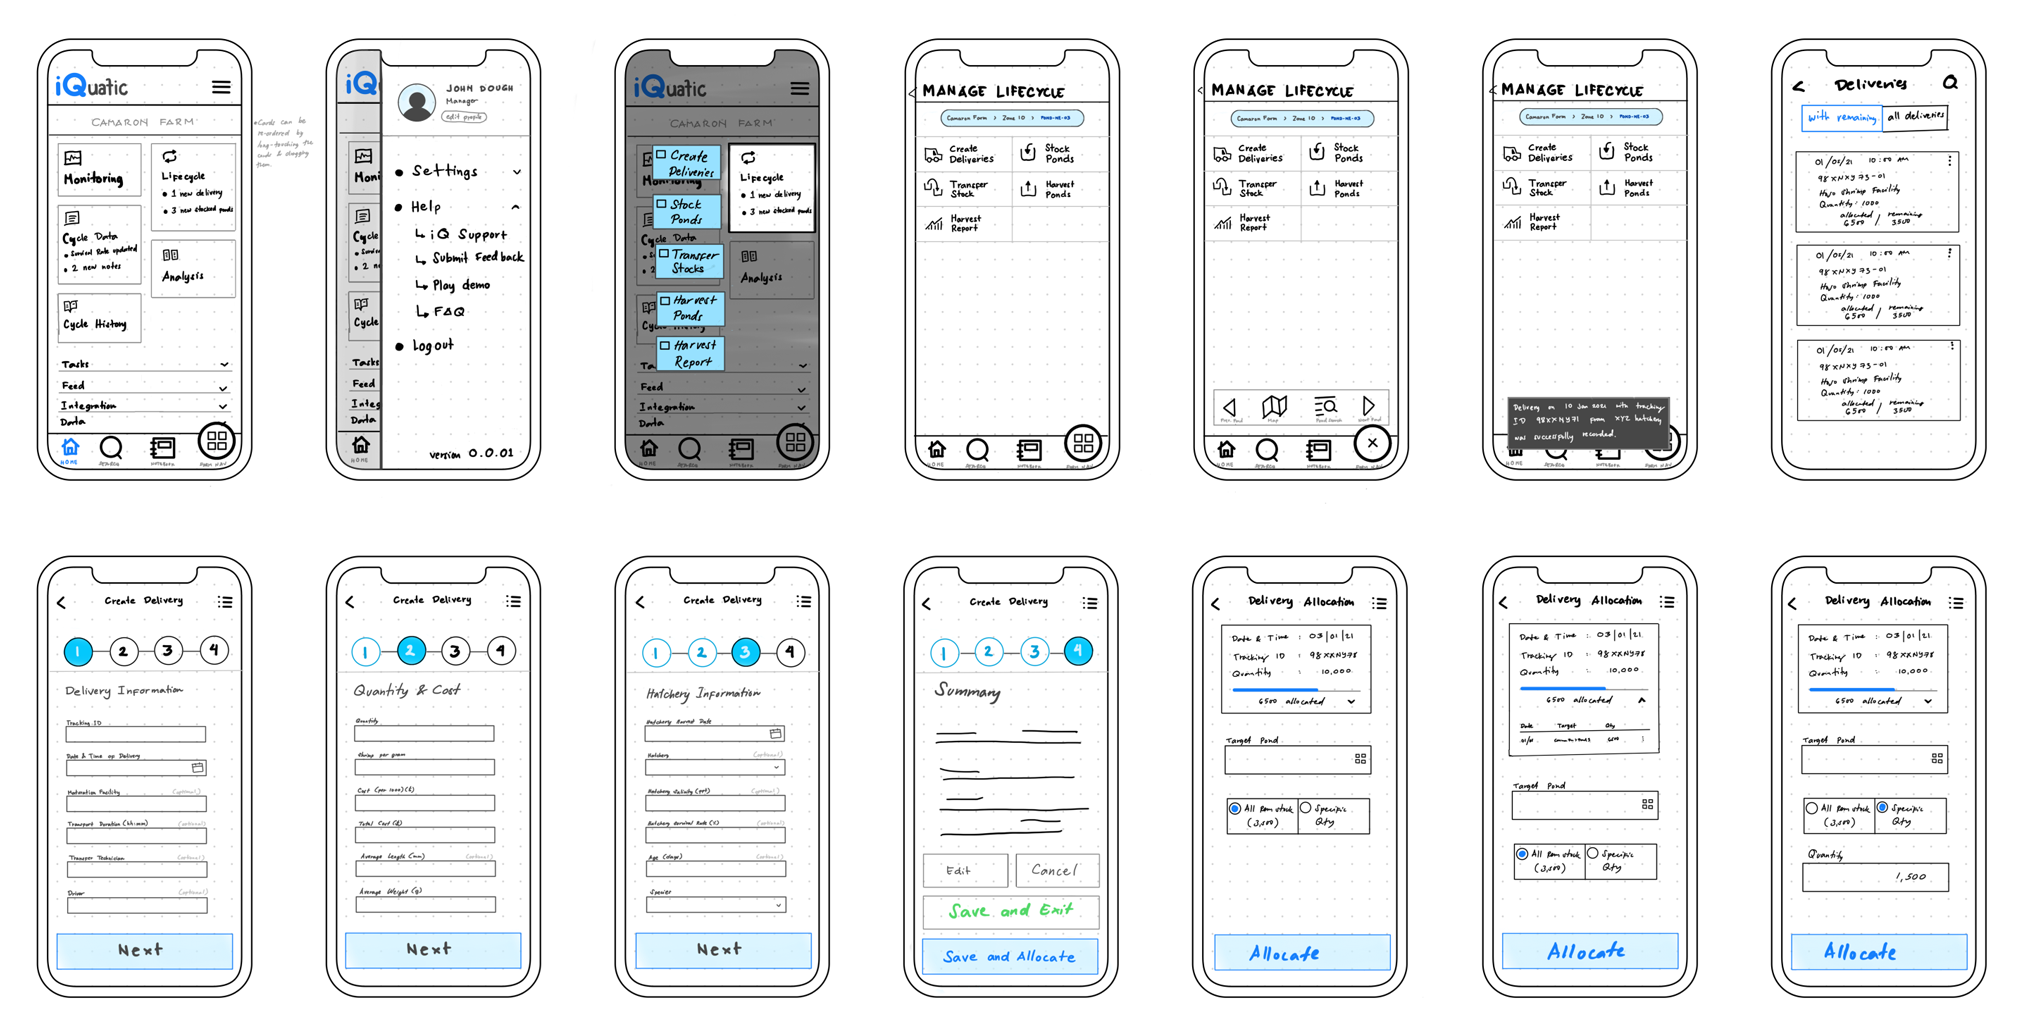
iQuatic mobile app wireframes
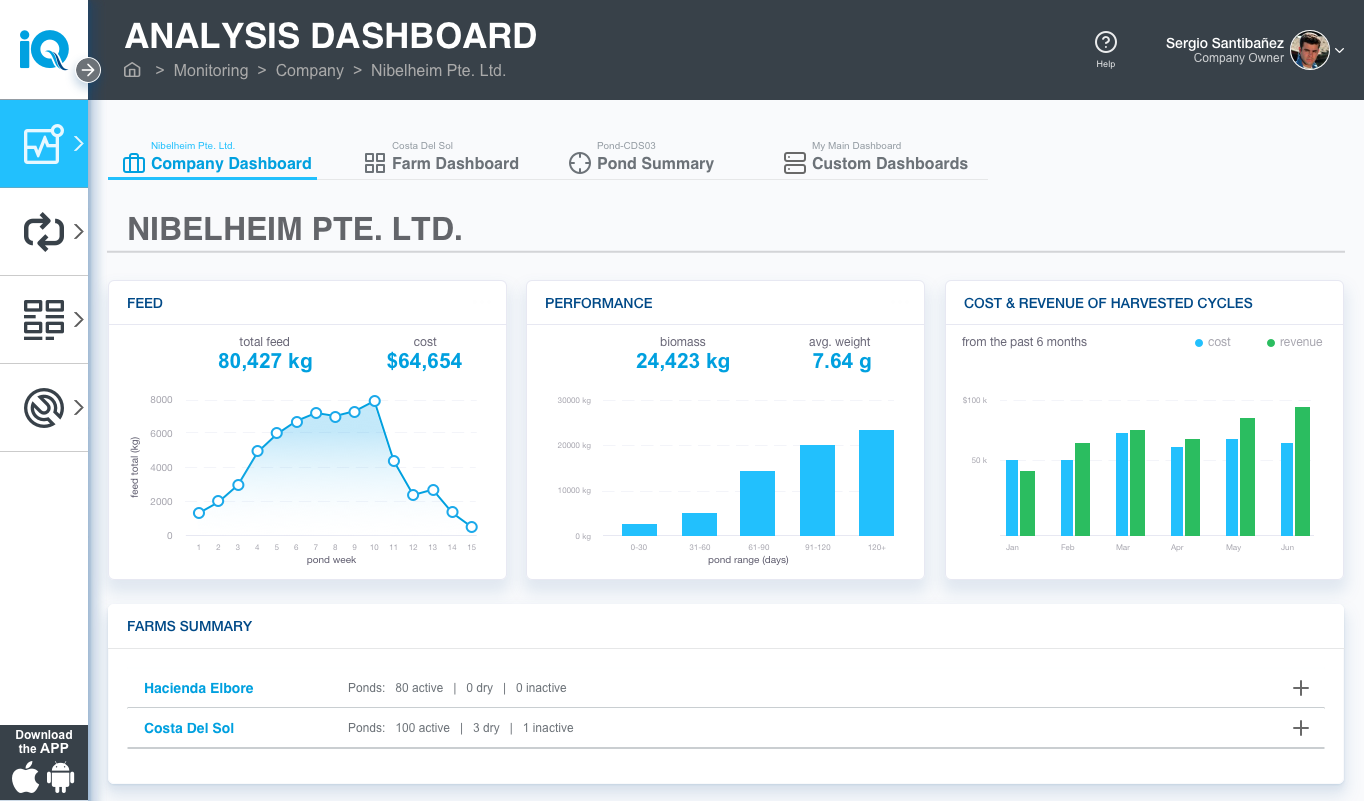
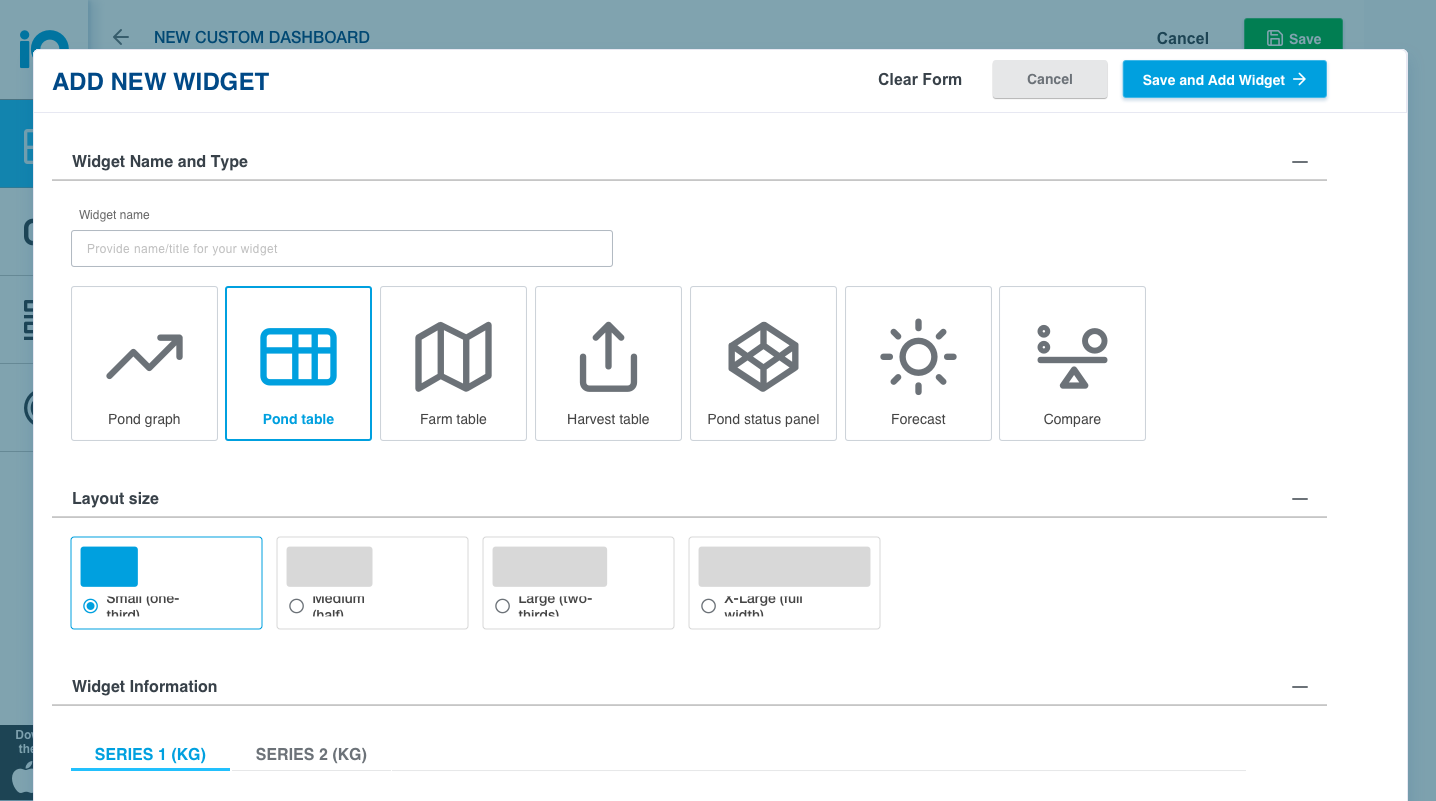
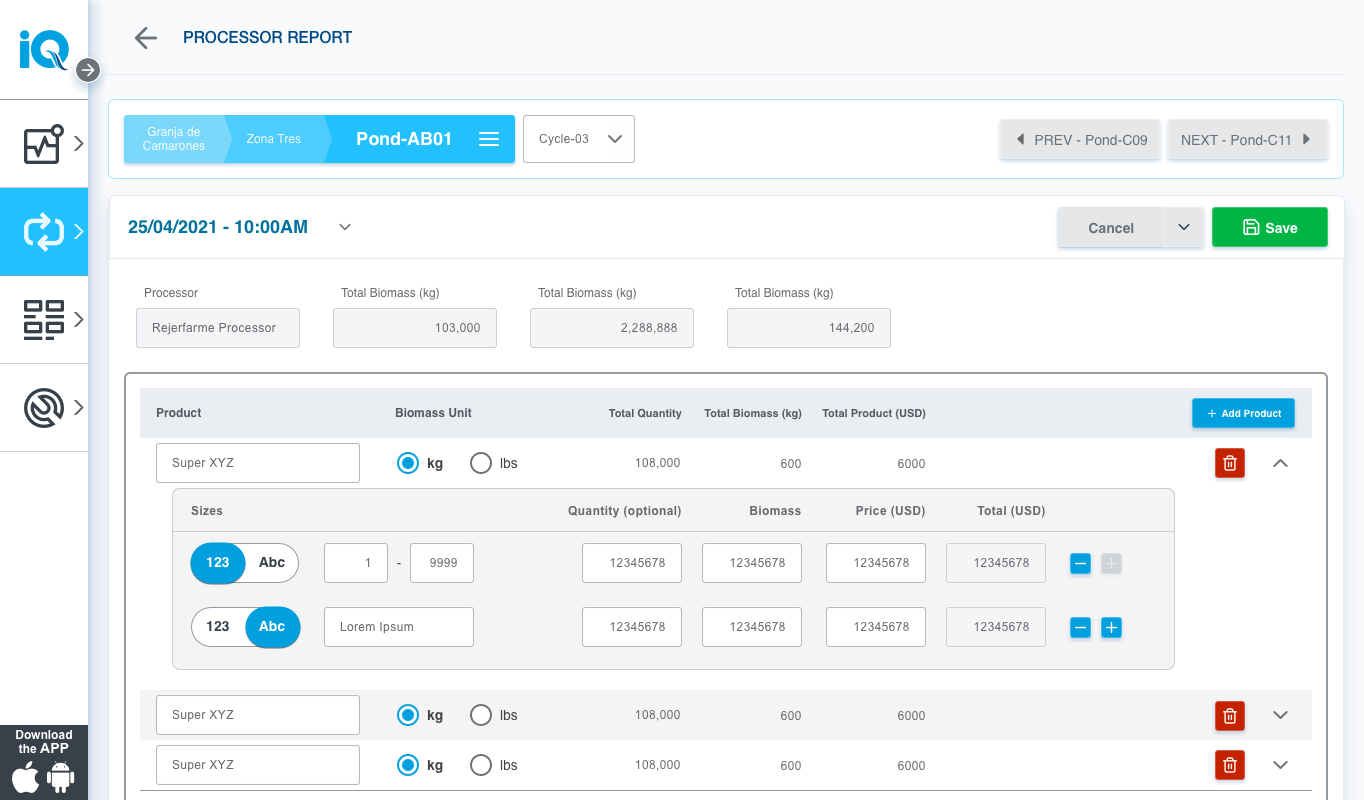
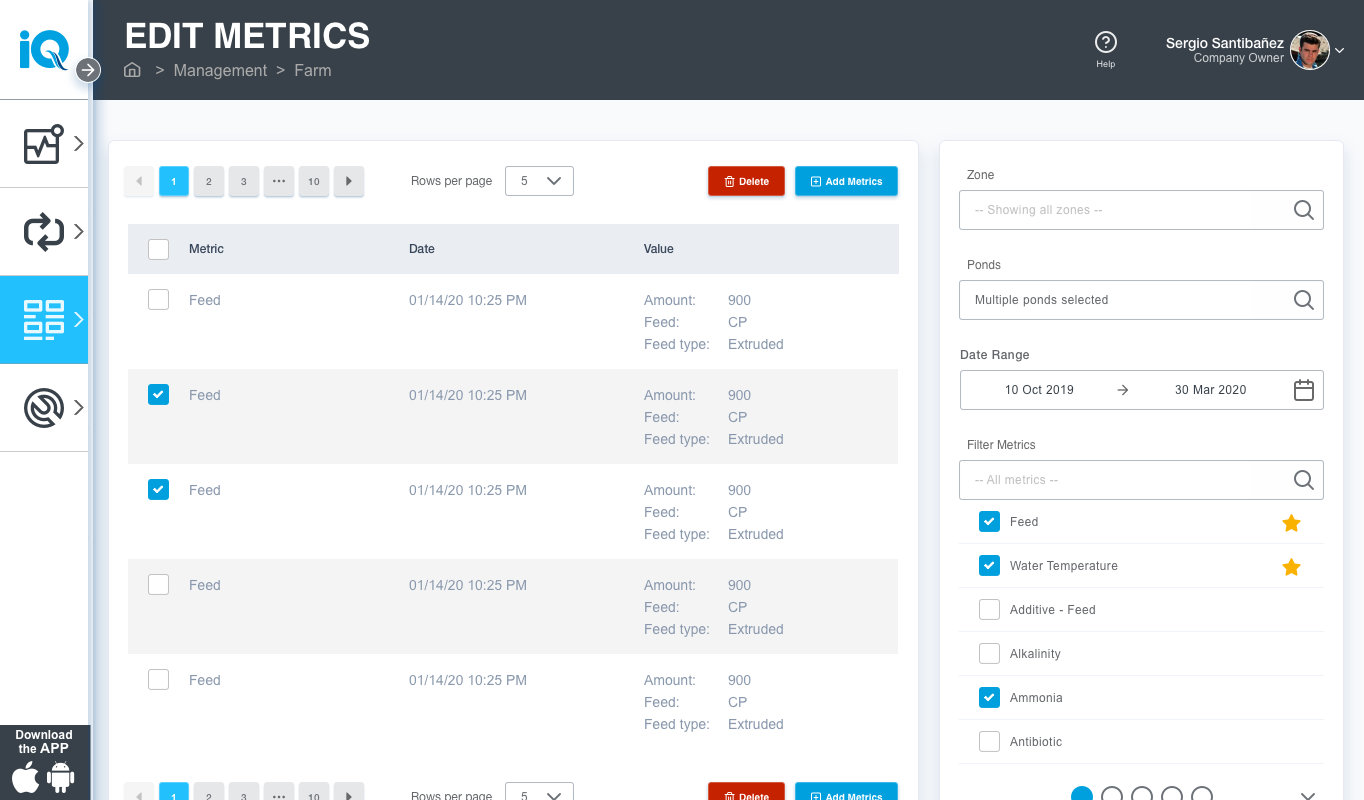
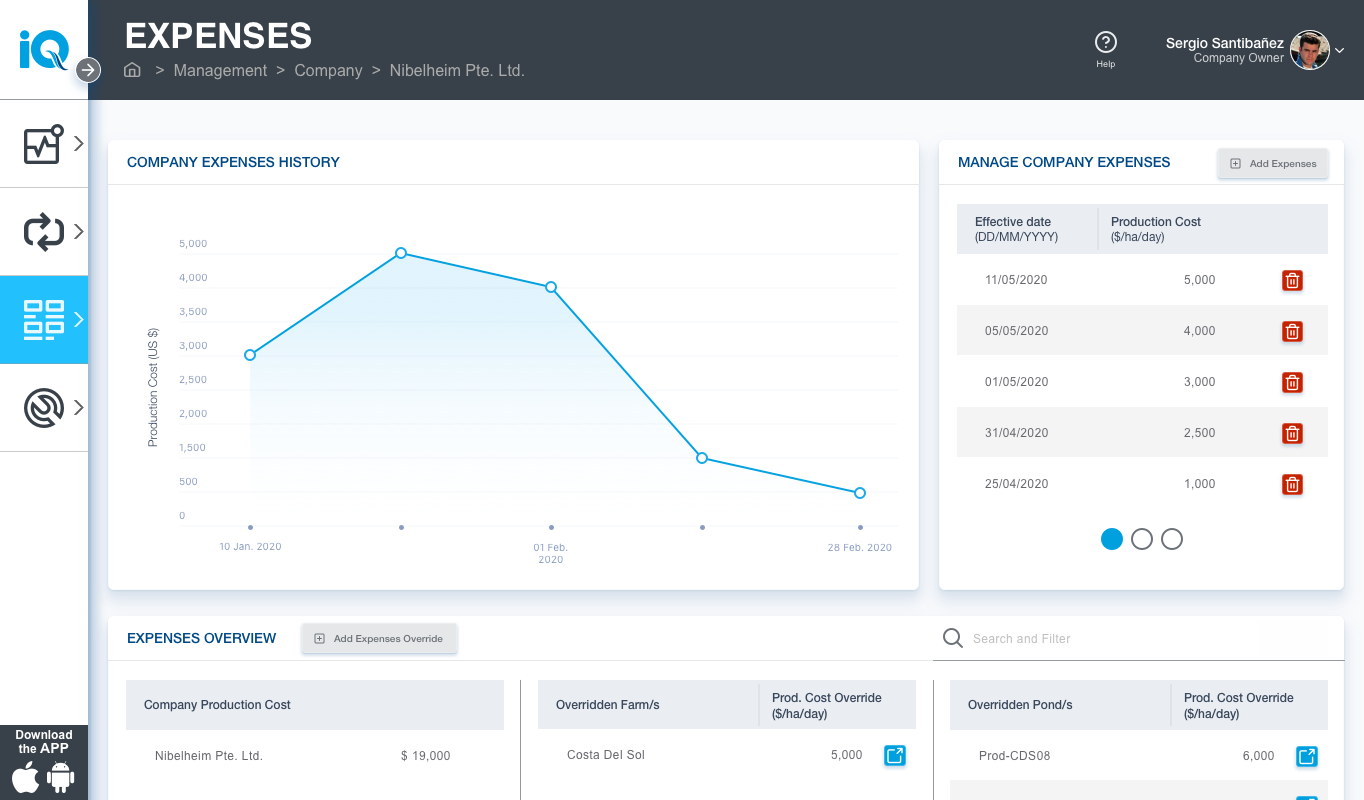
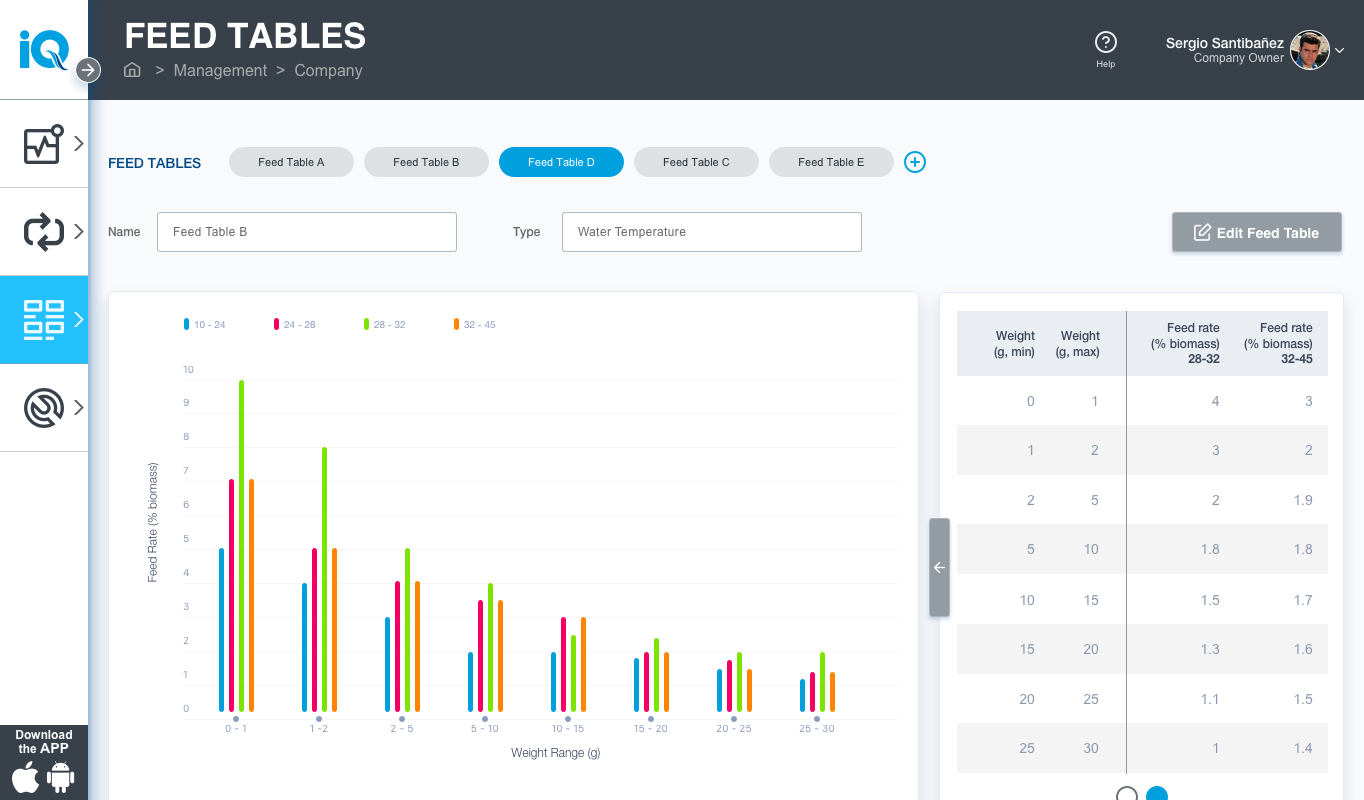
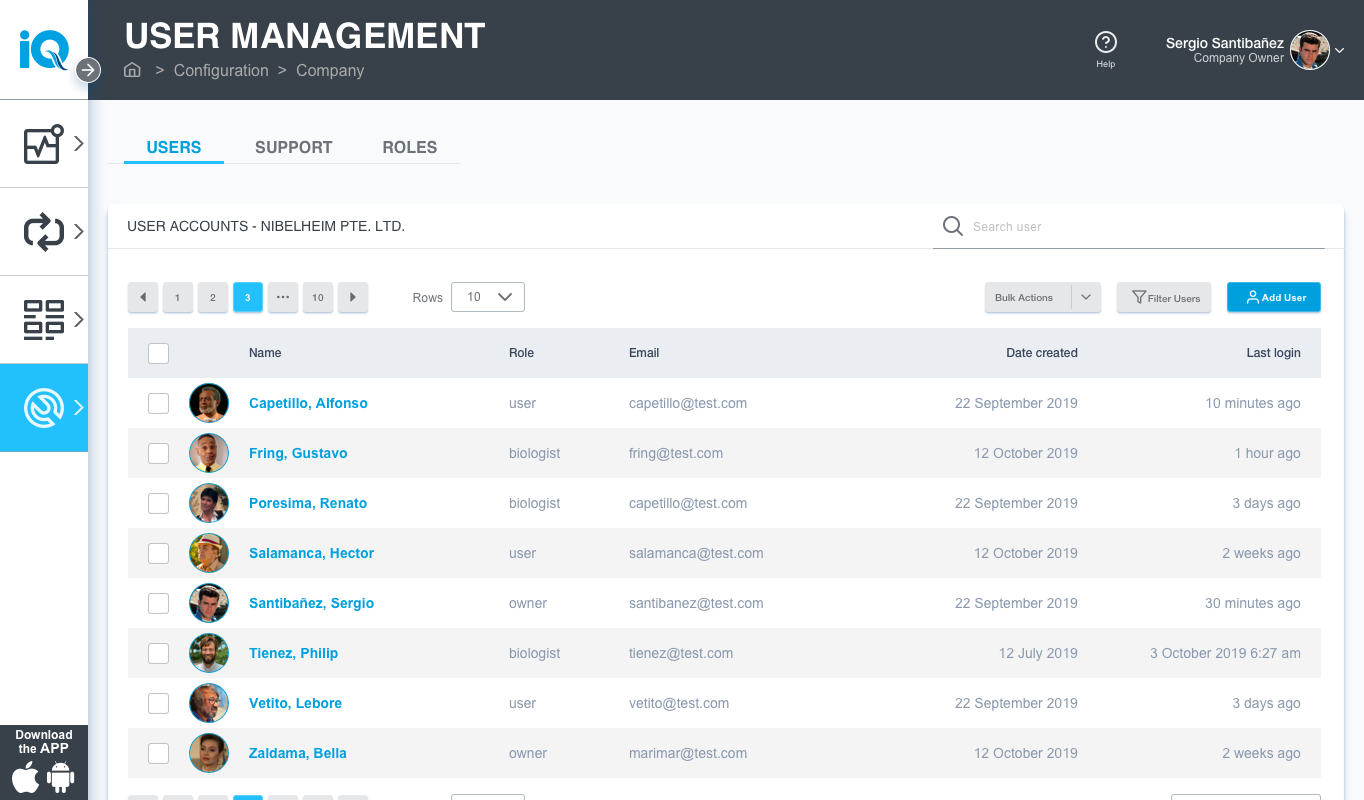
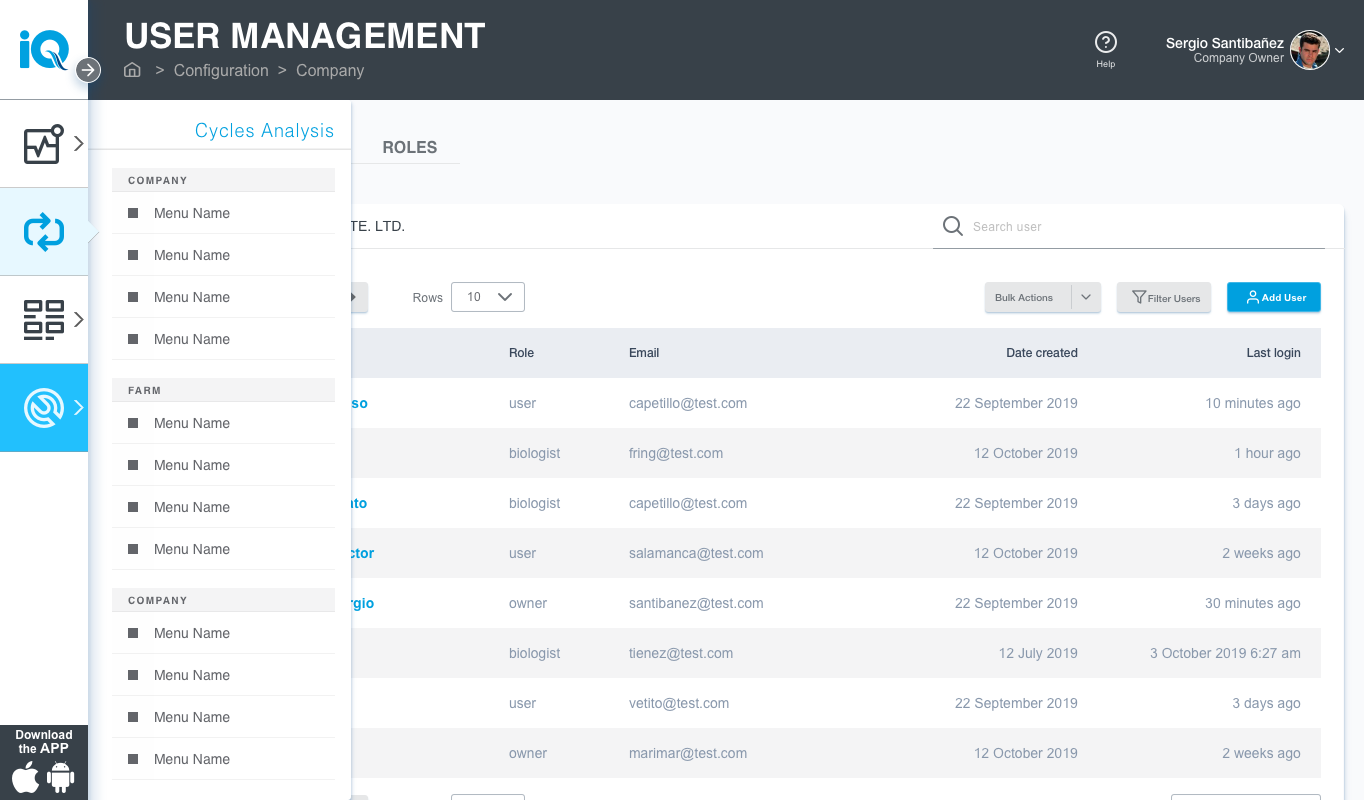
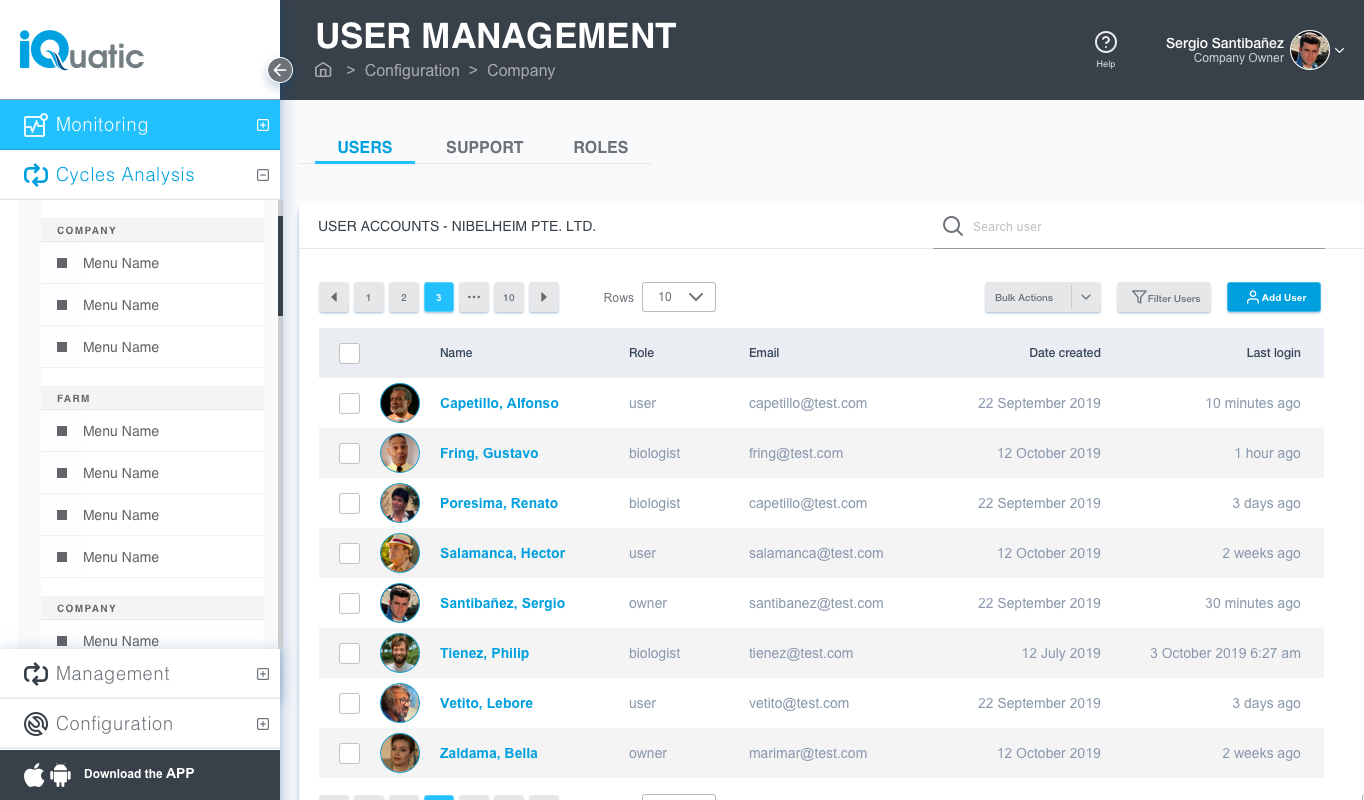
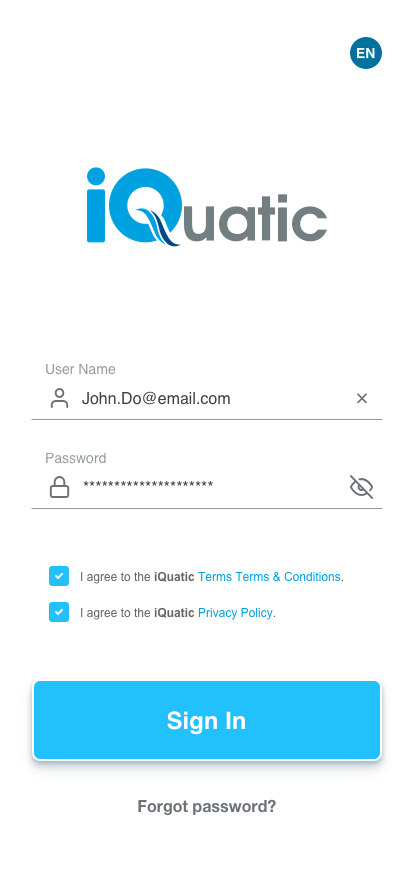
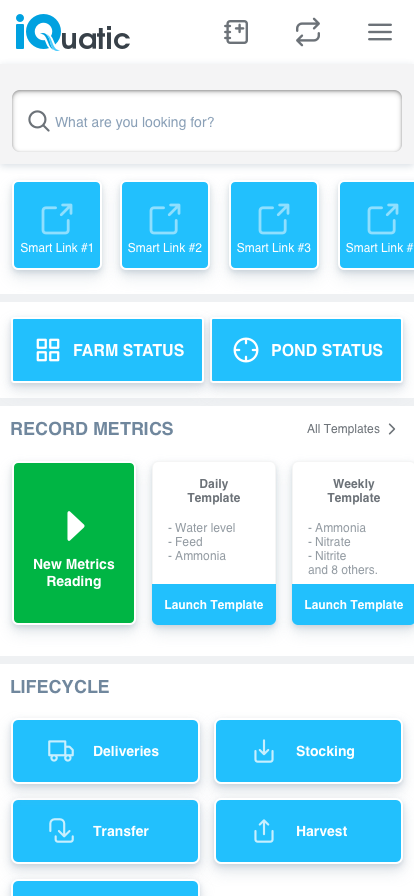
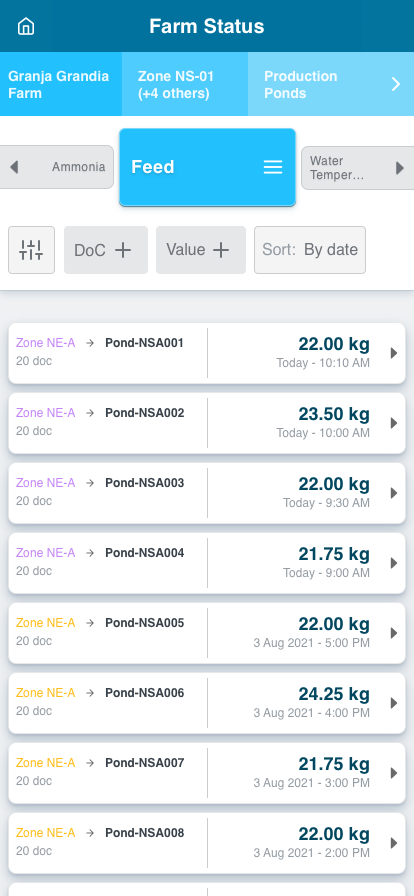
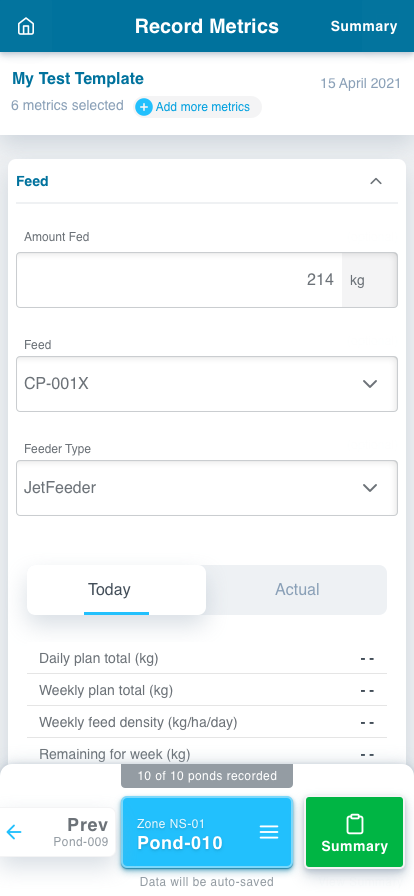
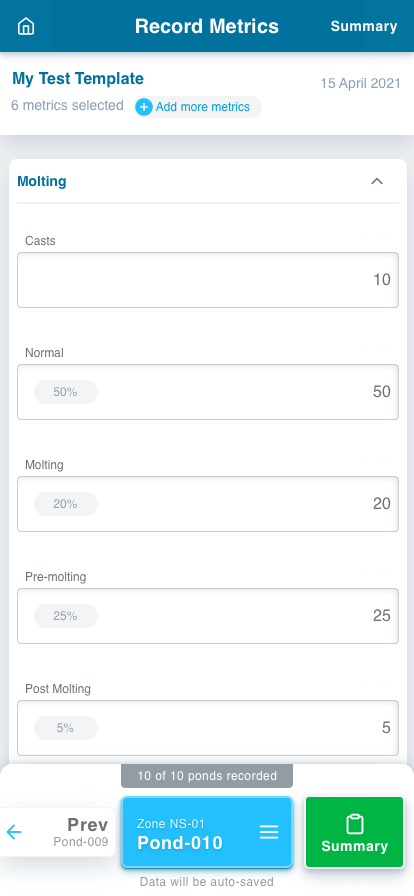
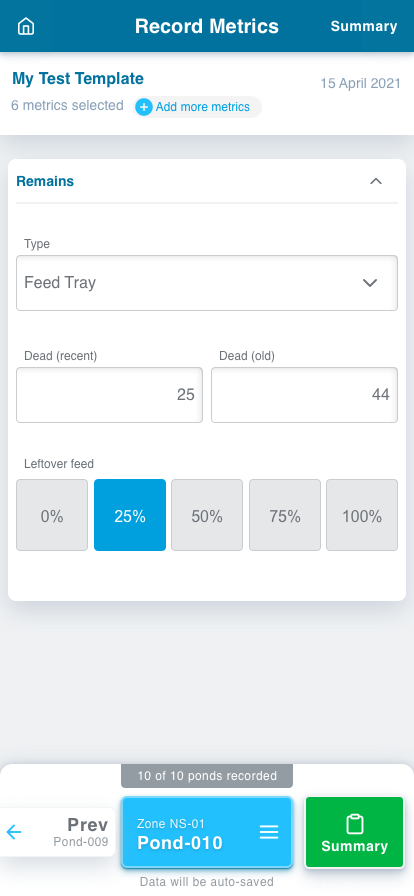
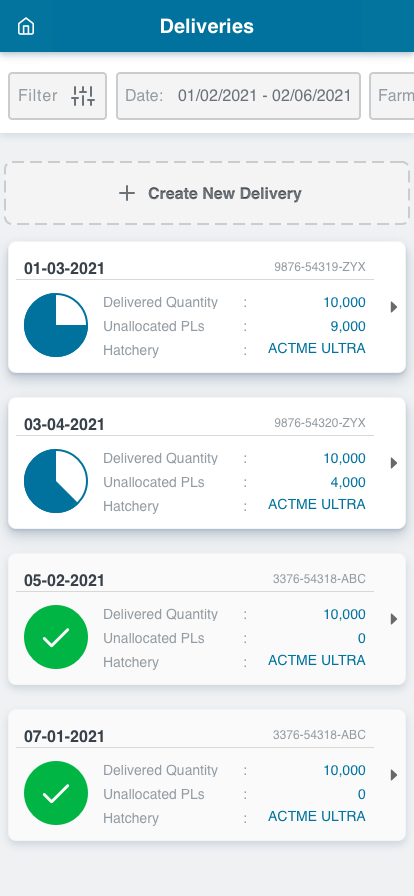
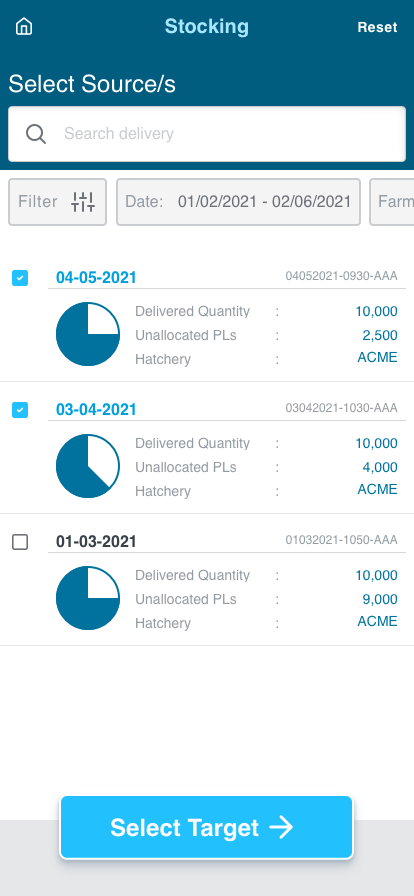
High-Fidelity Designs and UI System
Once the structure was validated, we moved to high-fidelity designs, ensuring consistency in branding, accessibility, and usability.


Interactive Prototype & Testing
Prototypes were developed to simulate real interactions, allowing users to experience the platform before development.
Regular design sprints were conducted to address design challenges and continuously refine the platform.
A dynamic, interactive design prototype was created using Sketch and InVision to enhance team collaboration and streamline usability testing.
Usability Testing
Remote and On-Site Testing
- Conducted tests across multiple farm locations.
- Gathered feedback from supervisors, technicians, and farm managers.
Testing Methods and Tools
- Mobile Testing Labs: Verified cross-device compatibility.
- Eye Tracking & A/B Testing: Optimized visual hierarchy and engagement.
- Heatmaps & Analytics (Hotjar, Google Analytics): Identified friction points and refined usability.
Development and Implementation
Core Features Built
- Real-Time Data Capture: Enabled on-site monitoring.
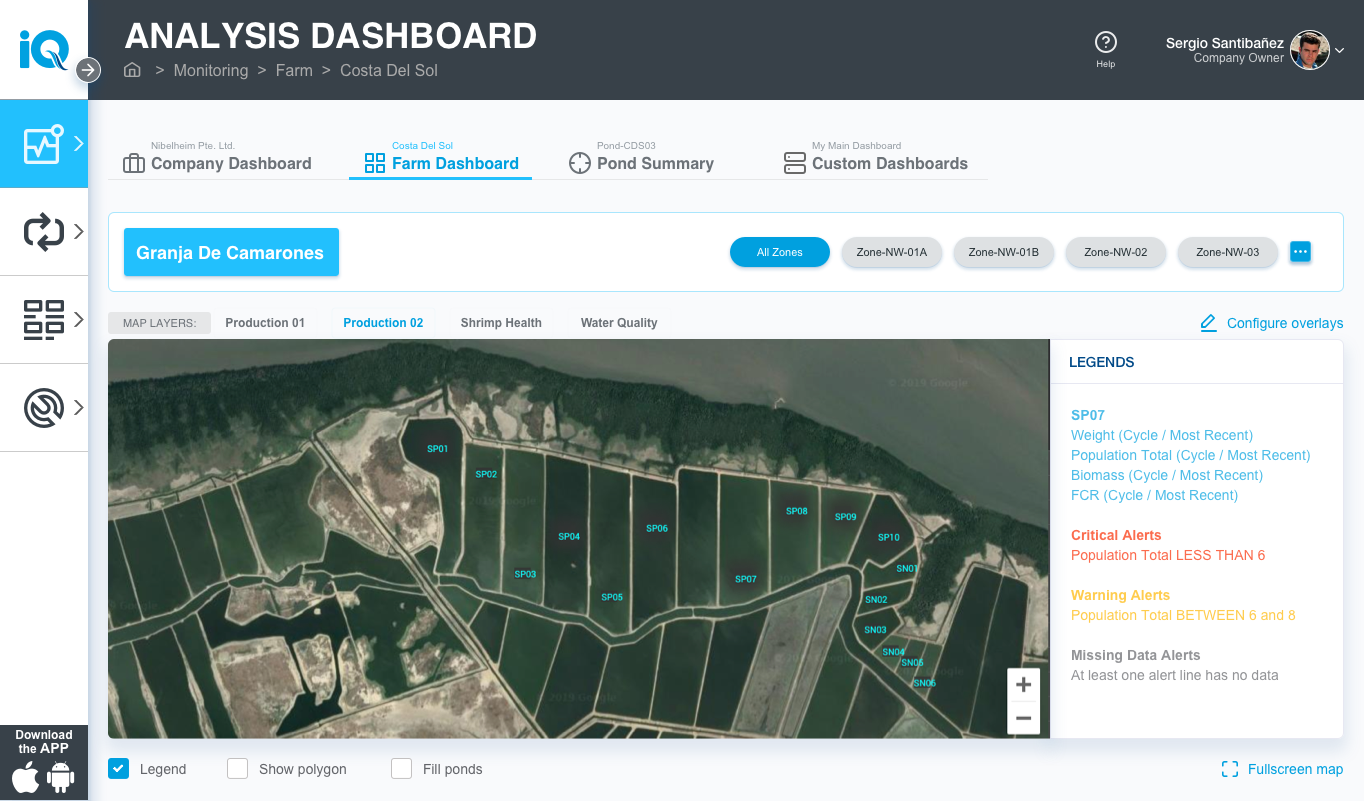
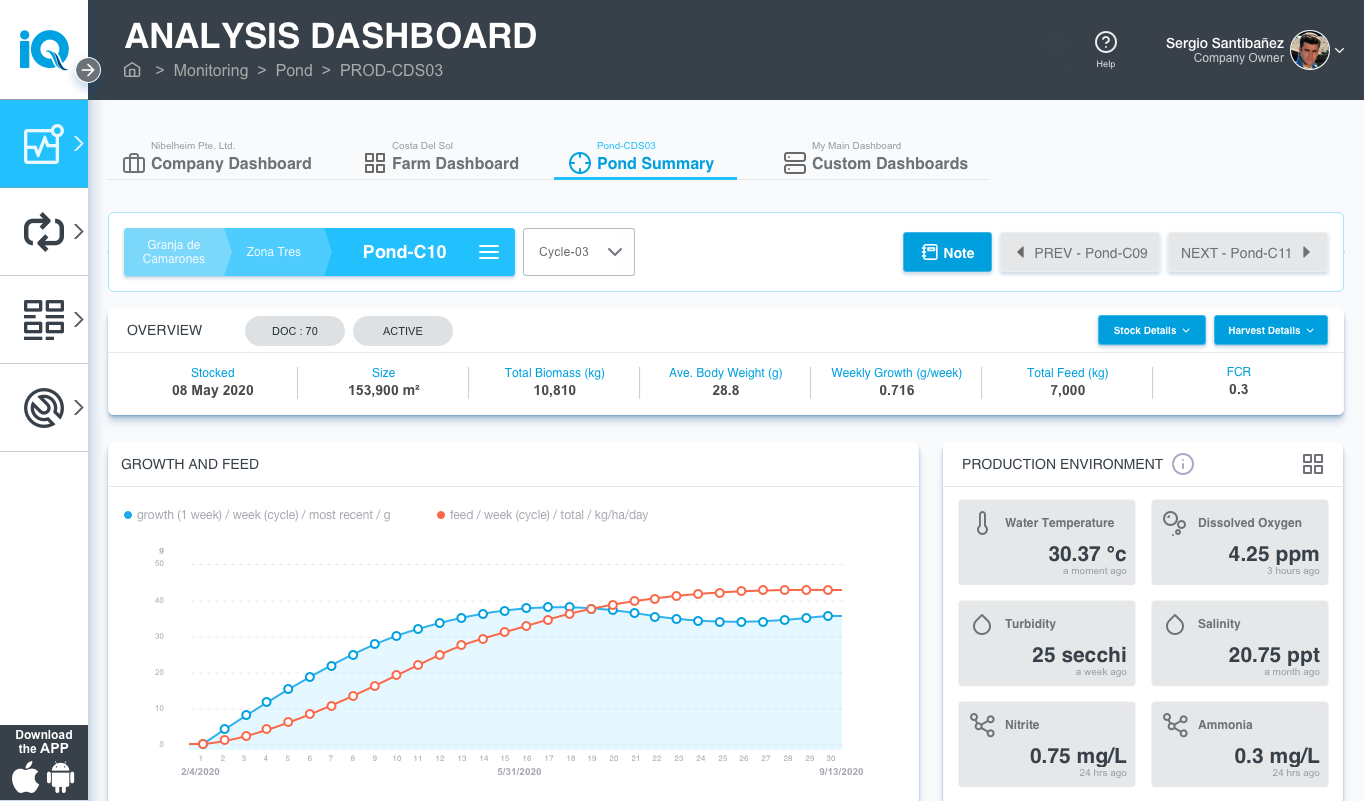
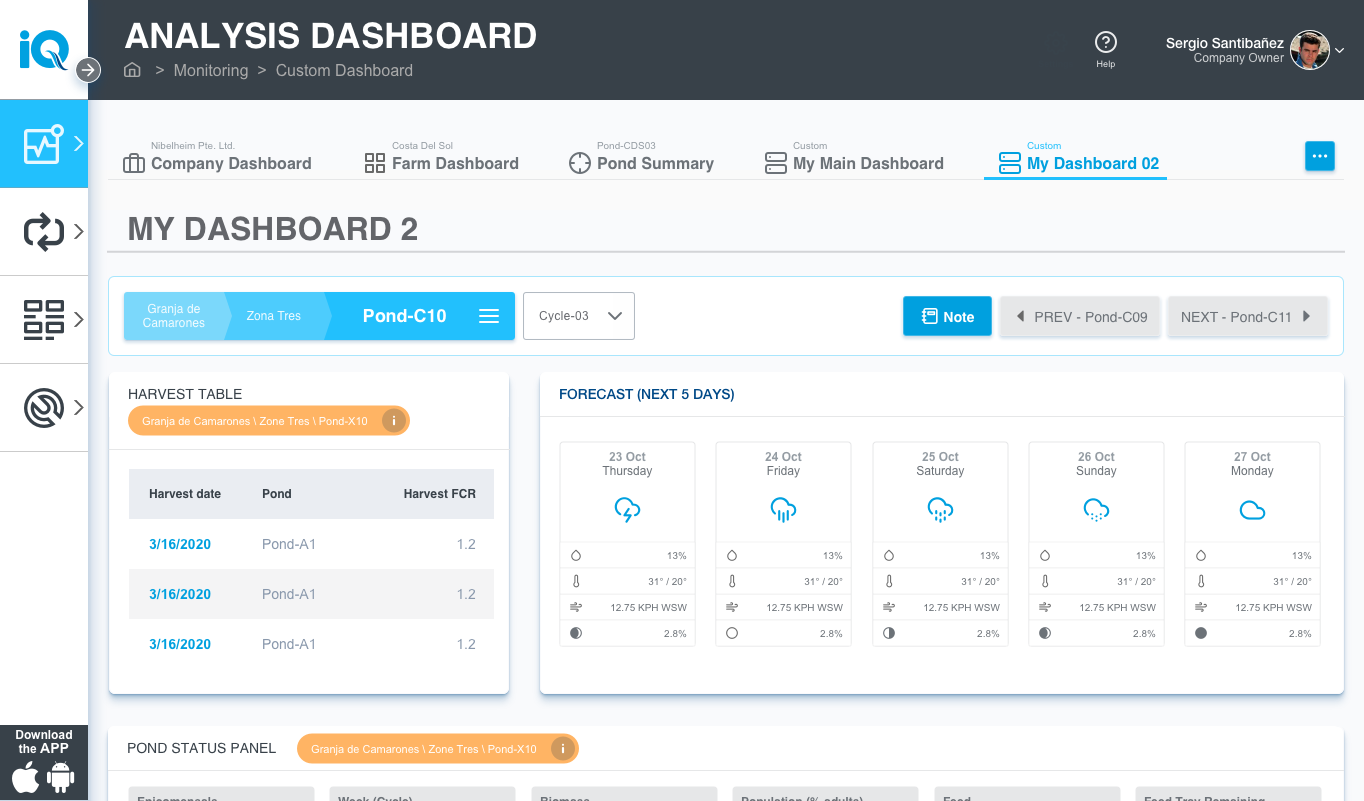
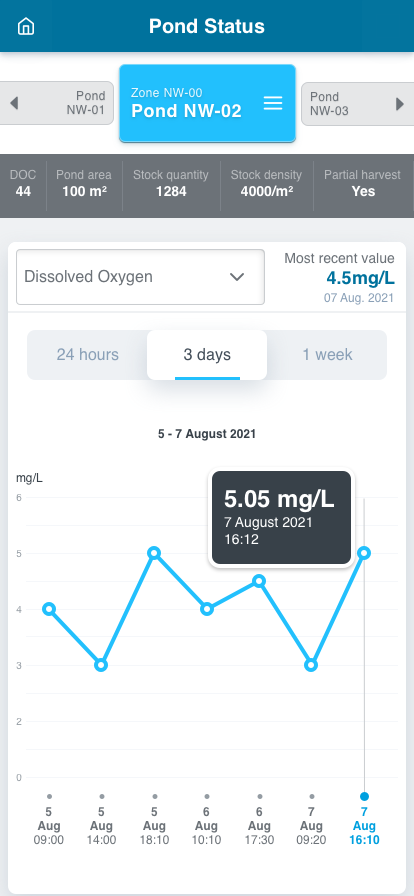
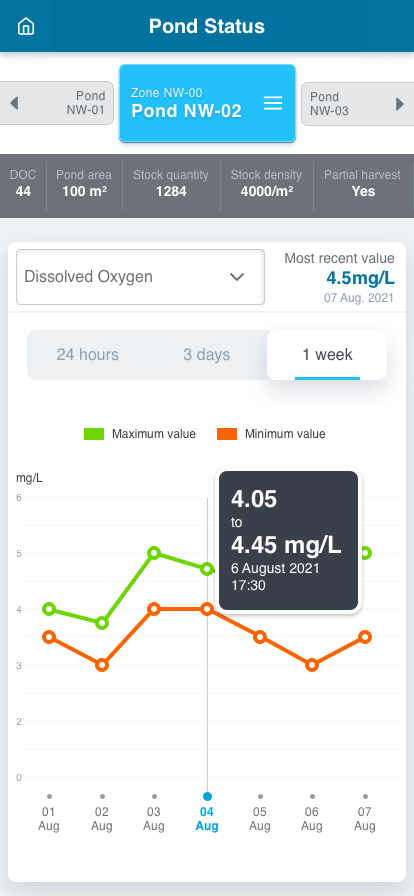
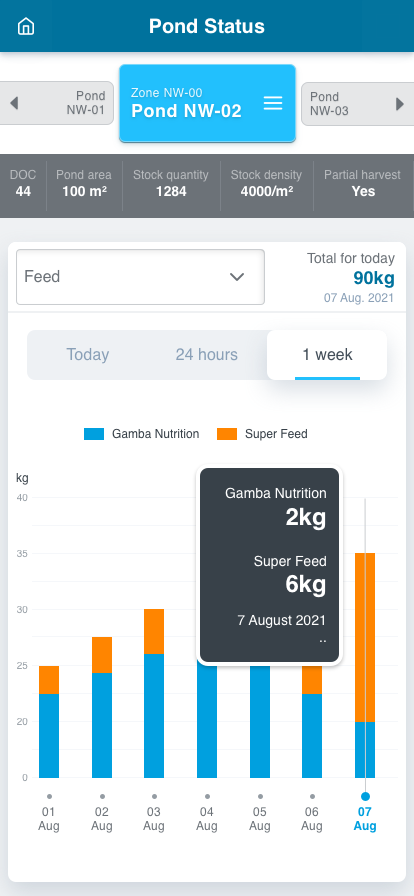
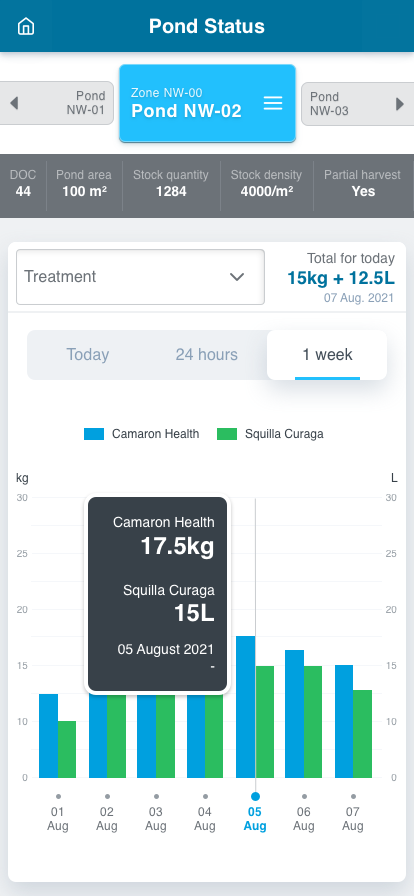
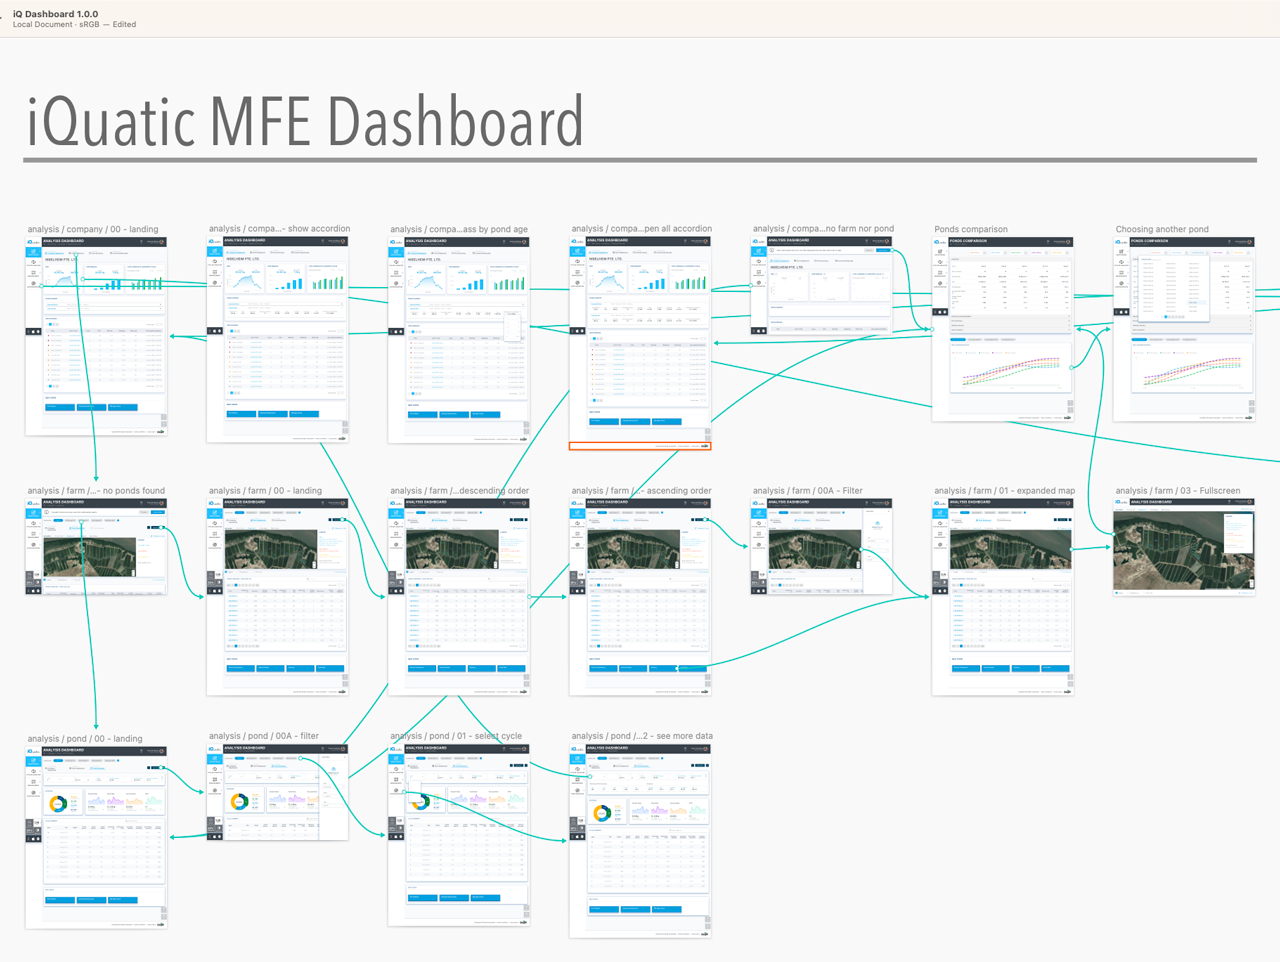
- Live Operations Dashboard: Provided comprehensive farm insights.
- Machine Learning Models: Delivered predictive insights on feeding and risk mitigation.
Product Offerings
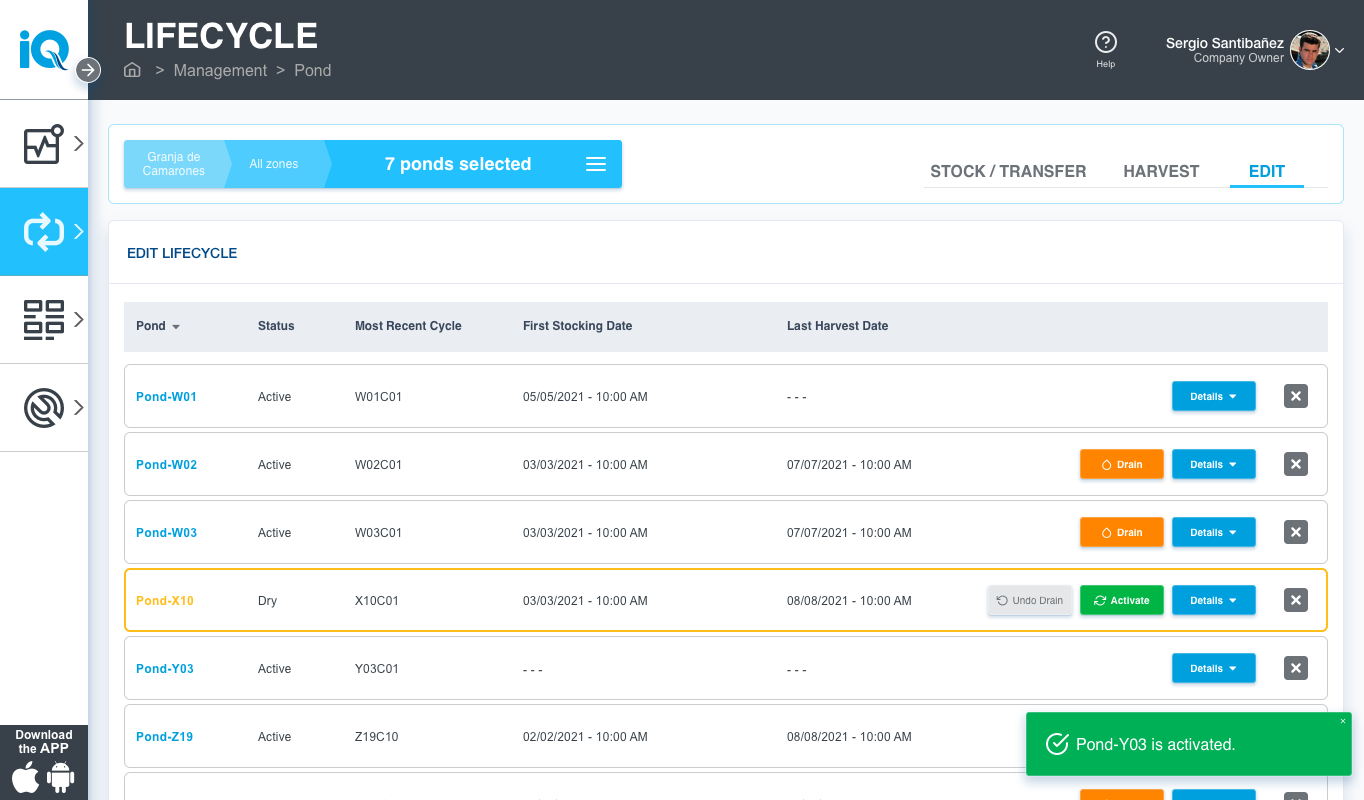
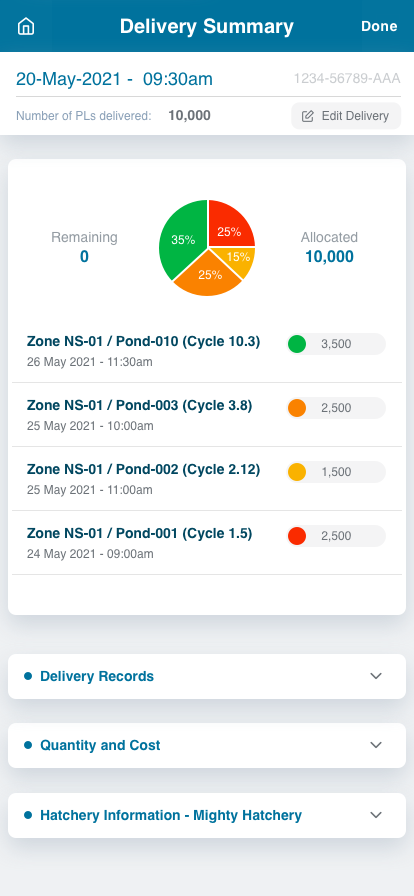
- iQShrimp Software: Centralized farm data management.
- Mobile App & Dashboard: Seamless remote monitoring.
- Farm Maps & Diagnostics: Health tracking and visual data representation.
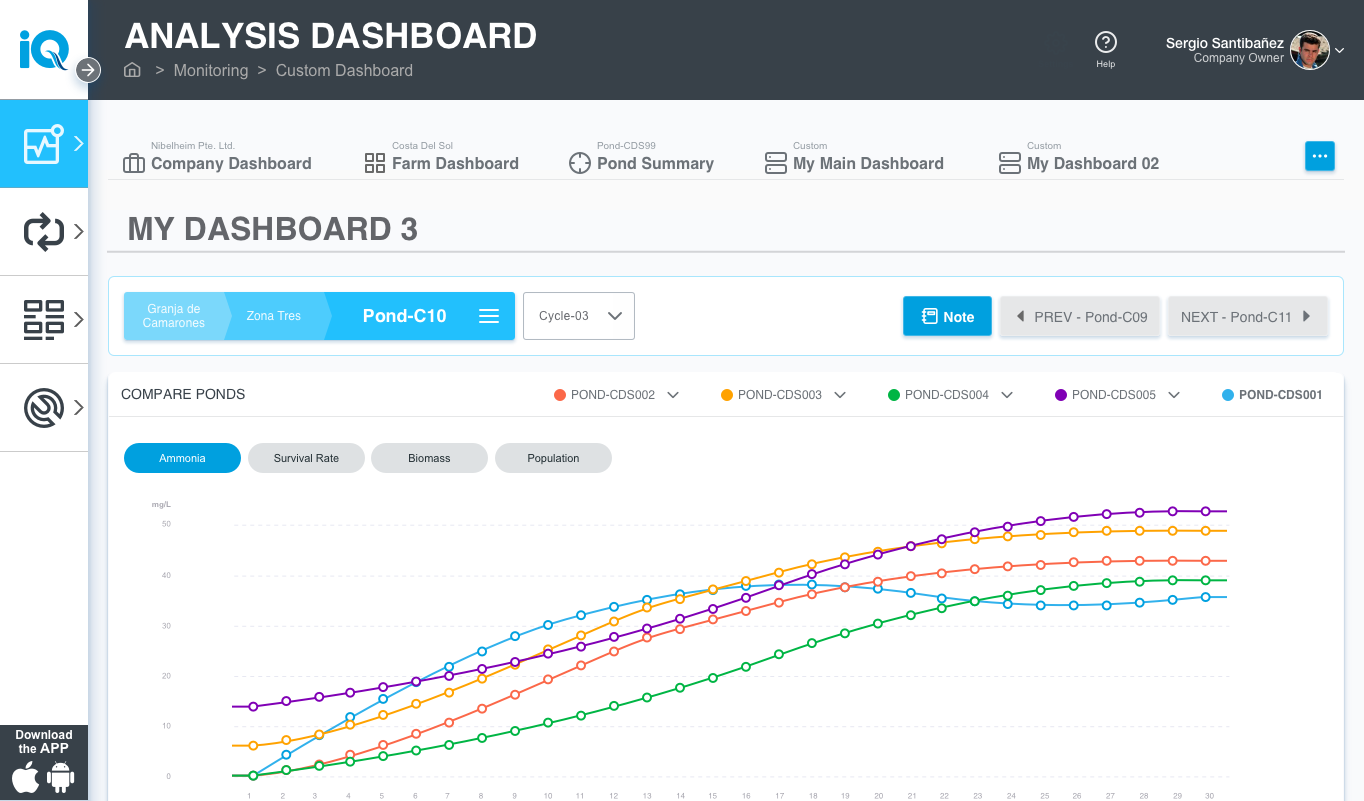
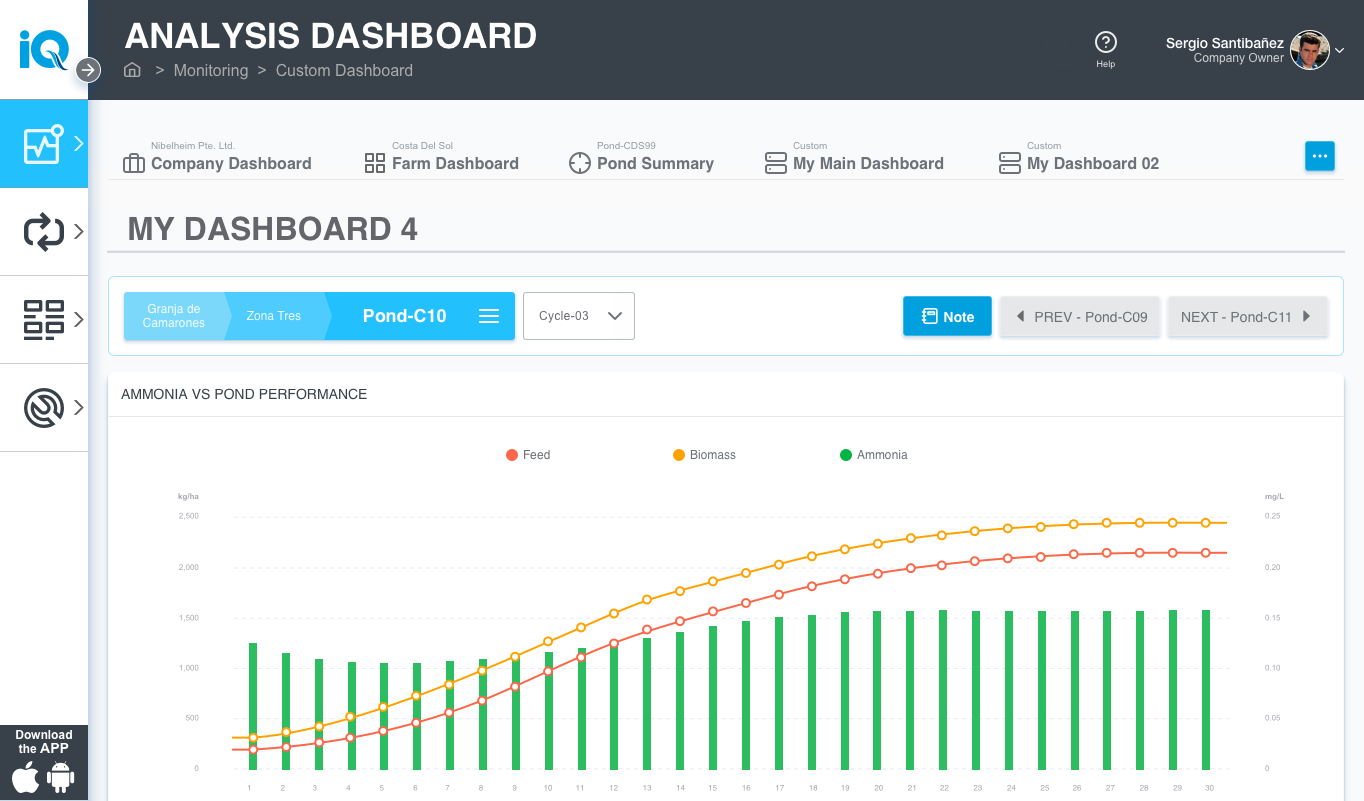
- Custom Analytics: Tailored dashboards for in-depth analysis.
Challenges and Solutions
| Challenge | Solution |
|---|---|
| Data Integration Issues | Agile, incremental integration with user feedback loops. |
| Weather Data Inaccuracy | Implemented validation systems for reliable forecasts. |
| OCR Recognition Variability | Enhanced recognition accuracy with machine learning. |
| Complex UI for Farmers | Iterative usability testing led to a streamlined design. |
| Resistance to Adoption | Hands-on training and onboarding strategies improved adoption. |
Impact and Results
- 60% Reduction in data entry time.
- Significant Decrease in manual errors.
- Improved Productivity, leading to higher shrimp yields.
- Enhanced User Experience, resulting in increased platform adoption.
- Expanded Adoption, with farm supervisors integrating iQuatic into daily operations.
Conclusion and Future Steps
The iQuatic project showcases how user-centered design can revolutionize traditional industries. By solving shrimp farmers’ challenges with data-driven, intuitive solutions, iQuatic has paved the way for more efficient and sustainable aquaculture practices.
Next Steps:
- Expand predictive analytics capabilities.
- Further optimize mobile usability.
- Scale the platform for broader aquaculture applications.